Skewness and Outliers
The shape of a distribution gives important information about how data values are spread. Two key ideas used to describe the shape of a distribution are skewness and the presence of outliers.
Skewness
A distribution is said to be skewed if it is not symmetric.
There are two main types of skewness:
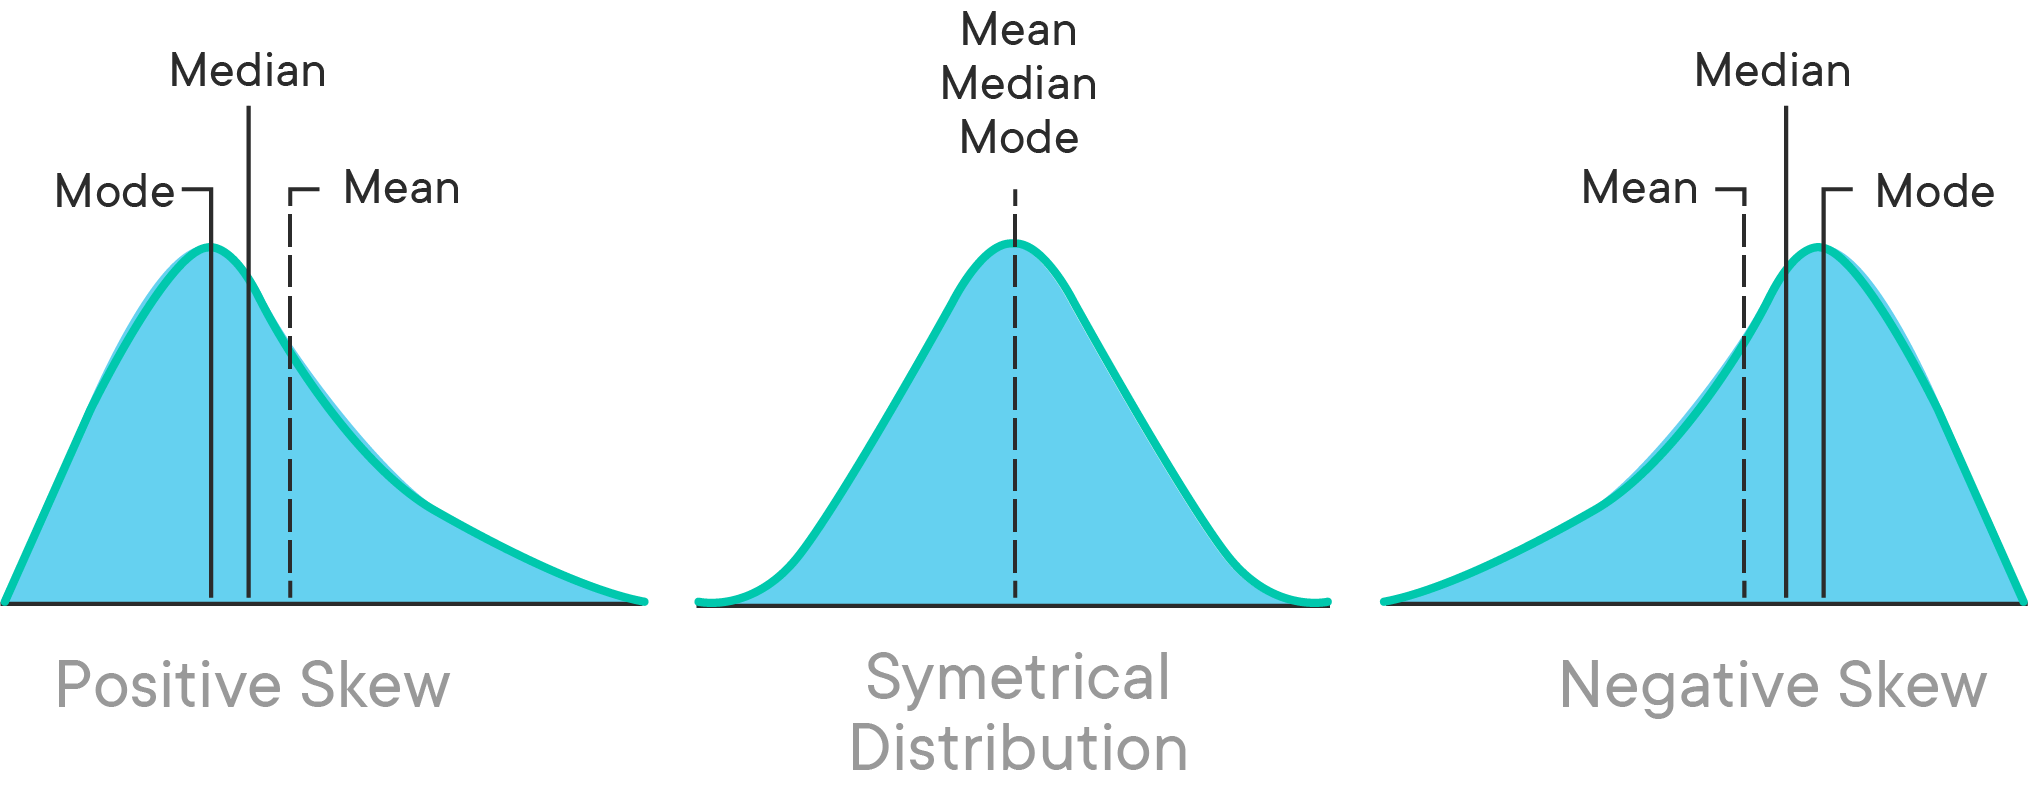
- Positive skew (right-skewed): the tail extends to the right
- Negative skew (left-skewed): the tail extends to the left
The relationship between the mean and median helps identify skewness:
| Type of Distribution | Relationship |
|---|---|
| Positively skewed | Mean > Median |
| Negatively skewed | Mean < Median |
| Symmetric | Mean ≈ Median |
Outliers
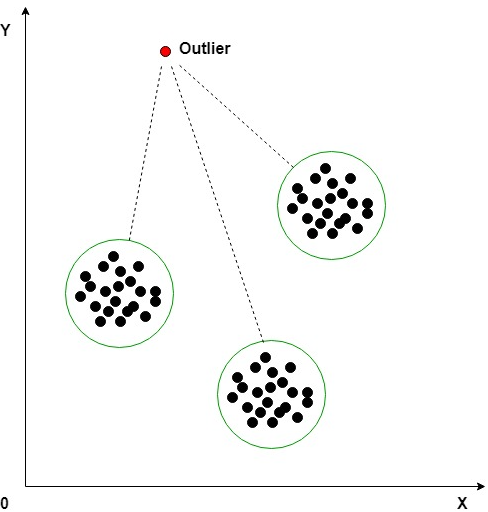
An outlier is a value that lies an unusually long way from the rest of the data.
Outliers can:
- Have a large effect on the mean and range
- Have little effect on the median and interquartile range
Any rule used to identify outliers will be stated in the question. A commonly used rule is based on the interquartile range.
Outliers and Box Plots
A box plot displays:

- Minimum and maximum values (excluding outliers)
- Lower quartile, median, and upper quartile
When outliers are present:
- They are plotted as individual points beyond the whiskers
- The whiskers extend only to the largest and smallest non-outlier values
Example :
A data set has a mean of 52 and a median of 47. Describe the skewness of the distribution.
▶️ Answer/Explanation
The mean is greater than the median.
This indicates a positively skewed distribution
Conclusion: The distribution is skewed to the right.
Example :
The lower quartile of a data set is 18 and the upper quartile is 30. An observation has value 50. Given that an outlier is defined as any value greater than \( \text{UQ} + 1.5 \times \text{IQR} \), determine whether 50 is an outlier.
▶️ Answer/Explanation
First find the interquartile range:
\( \text{IQR} = 30 – 18 = 12 \)
Upper outlier boundary:
\( 30 + 1.5 \times 12 = 48 \)
Since \( 50 > 48 \):
Conclusion: 50 is an outlier.
Example :
A box plot is drawn for a data set using the rule values less than \( \text{LQ} – 1.5 \times \text{IQR} \) or greater than \( \text{UQ} + 1.5 \times \text{IQR} \) are outliers. Explain how outliers should be shown on the box plot.
▶️ Answer/Explanation
Outliers are plotted as individual points beyond the whiskers.
The whiskers:
Extend only to the largest and smallest non-outlier values
Conclusion: Outliers are clearly identified without affecting the box itself.