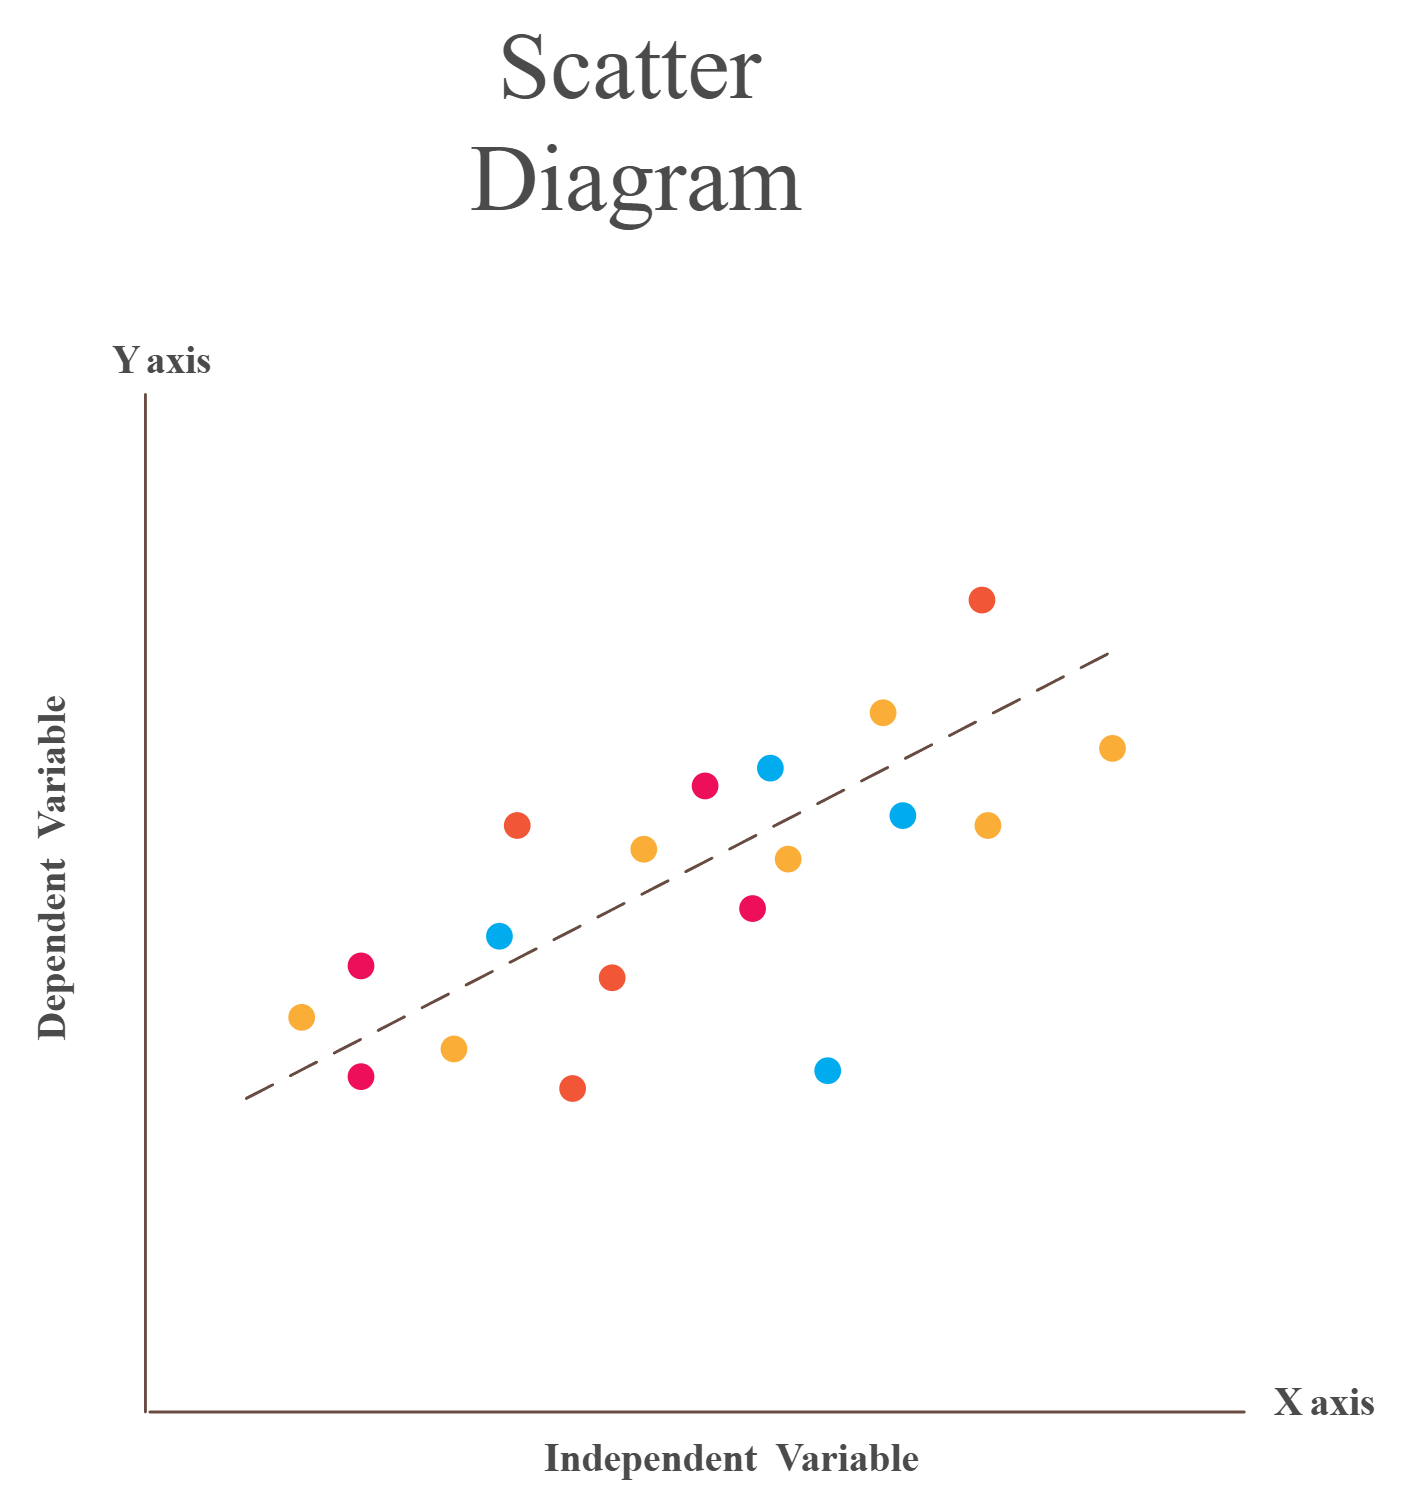
Scatter Diagrams
A scatter diagram (or scatter graph) is used to display the relationship between two variables. Each point on the diagram represents one pair of values \( (x, y) \).
Scatter diagrams are mainly used to:
- Identify whether a relationship exists between two variables
- Describe the type and strength of correlation
- Support the drawing of a regression line
Correlation
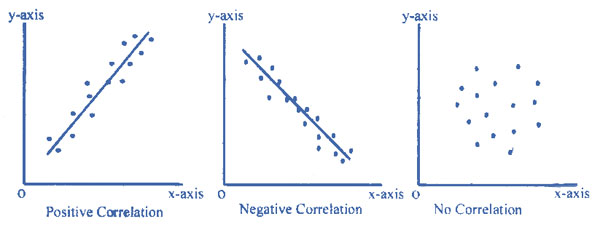
Correlation describes the direction of the relationship between two variables.
| Type of Correlation | Description |
|---|---|
| Positive | As \( x \) increases, \( y \) tends to increase |
| Negative | As \( x \) increases, \( y \) tends to decrease |
| No correlation | No clear relationship |
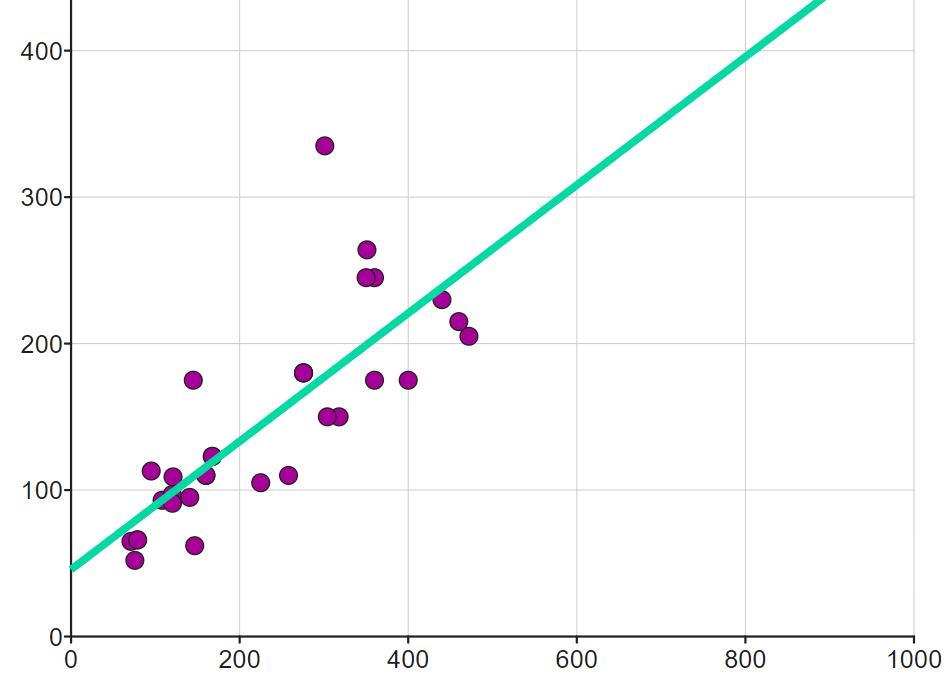
Regression Line
A regression line is a straight line drawn on a scatter diagram to represent the general trend of the data.
In this syllabus:
- Students may be required to draw a regression line by eye
- The line should pass close to as many points as possible
- Roughly equal numbers of points should lie above and below the line
The regression line is often used for estimation, but only within the range of the given data.
Important Notes
- Correlation does not imply causation
- Extrapolation beyond the data range may be unreliable
Example :
A scatter diagram shows that as the number of hours studied increases, exam marks tend to increase. Describe the correlation.
▶️ Answer/Explanation
As one variable increases, the other also increases.
Conclusion: There is positive correlation.
Example :
Explain how a regression line should be drawn on a scatter diagram.
▶️ Answer/Explanation
Draw a straight line that follows the overall trend of the data
Ensure roughly equal numbers of points lie above and below the line
Conclusion: The line represents the best visual fit to the data.
Example :
A regression line drawn on a scatter diagram is used to estimate a value outside the range of the data. Comment on the reliability of this estimate.
▶️ Answer/Explanation
Estimating outside the data range involves extrapolation.
Conclusion: The estimate may be unreliable.
Linear Regression
Linear regression is used to model the relationship between two variables by fitting a straight line to a set of paired data. The line is chosen so that it represents the overall trend of the data as accurately as possible.
In this syllabus, the equation of the regression line is found using the method of least squares.
Equation of the Regression Line
The equation of the regression line of \( y \) on \( x \) is written as
\( y = a + bx \)
where:
\( b \) is the gradient
\( a \) is the intercept on the \( y \)-axis
Method of Least Squares
The least squares method chooses the line that minimises the sum of the squares of the vertical distances between the observed points and the regression line.
The gradient \( b \) and intercept \( a \) are given by
\( b = \dfrac{\sum (x – \bar{x})(y – \bar{y})}{\sum (x – \bar{x})^2} \)
\( a = \bar{y} – b\bar{x} \)
The regression line always passes through the point \( (\bar{x}, \bar{y}) \).
Use and Interpretation
- The regression line is used to estimate values of \( y \) for given values of \( x \)
- Estimates should only be made within the range of the observed data
- The equation does not imply a cause-and-effect relationship
Example :
The following summary statistics are calculated from a set of paired data:
\( \bar{x} = 4,\; \bar{y} = 10,\; \sum (x – \bar{x})^2 = 20,\; \sum (x – \bar{x})(y – \bar{y}) = 30 \)
Find the equation of the regression line of \( y \) on \( x \).
▶️ Answer/Explanation
Gradient:
\( b = \dfrac{30}{20} = 1.5 \)
Intercept:
\( a = 10 – 1.5 \times 4 = 4 \)
Conclusion: The regression line is \( y = 4 + 1.5x \).
Example :
A regression line has equation \( y = 2 + 0.8x \). Find the estimated value of \( y \) when \( x = 5 \), and comment on the use of this estimate.
▶️ Answer/Explanation
\( y = 2 + 0.8 \times 5 = 6 \)
The estimate is reasonable provided \( x = 5 \) lies within the range of the original data.
Conclusion: The estimated value is \( y = 6 \).
Example :
Explain why the regression line of \( y \) on \( x \) always passes through the point \( (\bar{x}, \bar{y}) \).
▶️ Answer/Explanation
The intercept is defined as
\( a = \bar{y} – b\bar{x} \)
Substituting \( x = \bar{x} \) into the regression equation gives
\( y = \bar{y} \)
Conclusion: The regression line always passes through \( (\bar{x}, \bar{y}) \).