Explanatory and Response Variables
In statistical modelling, relationships between two variables are described using an explanatory variable and a response variable. These ideas are fundamental when interpreting scatter diagrams and regression lines.
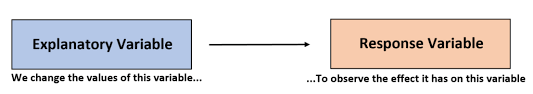
Explanatory (Independent) Variable
The explanatory variable is the variable that is believed to influence or explain changes in another variable.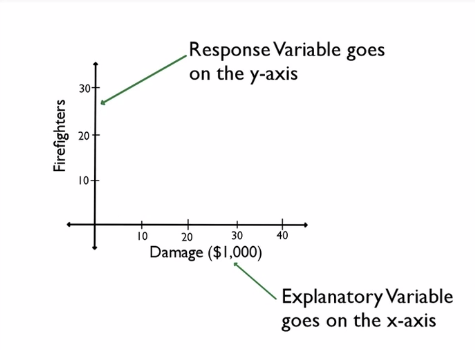
It is usually plotted on the horizontal axis
It is often controlled or selected
Common notation includes \( x \), but other symbols may be used.
Response (Dependent) Variable
The response variable is the variable whose value is observed or measured as a result of changes in the explanatory variable.
It is usually plotted on the vertical axis
Its value depends on the explanatory variable
Common notation includes \( y \), but other symbols may be used.
Applications and Interpretation
When a regression line is used:
- The explanatory variable is used to predict the response variable
- The relationship describes association, not causation
Interpretation must always be given in the context of the data.
Predictions and Extrapolation
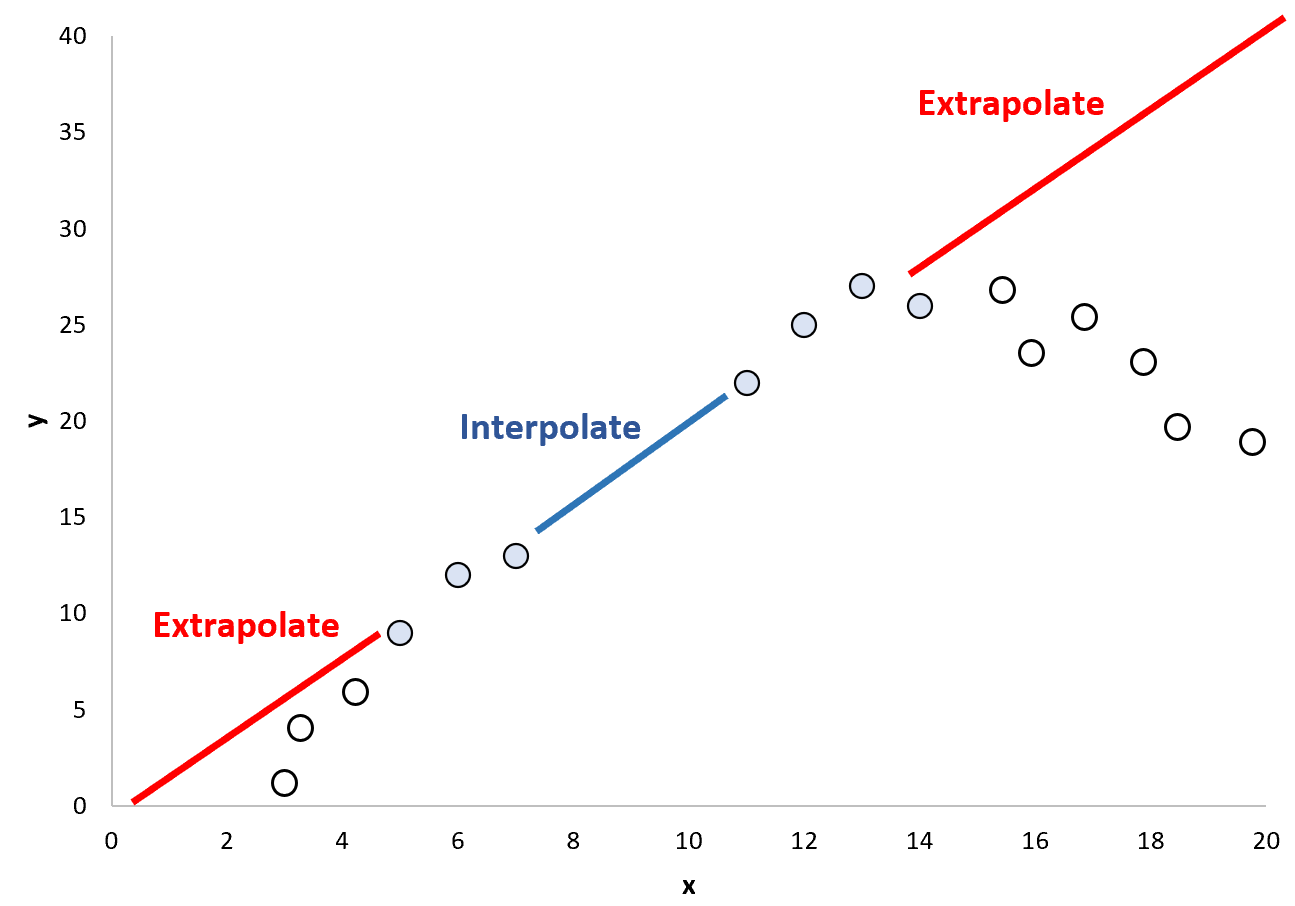
Regression equations should only be used to make predictions:
Within the range of the observed explanatory variable values
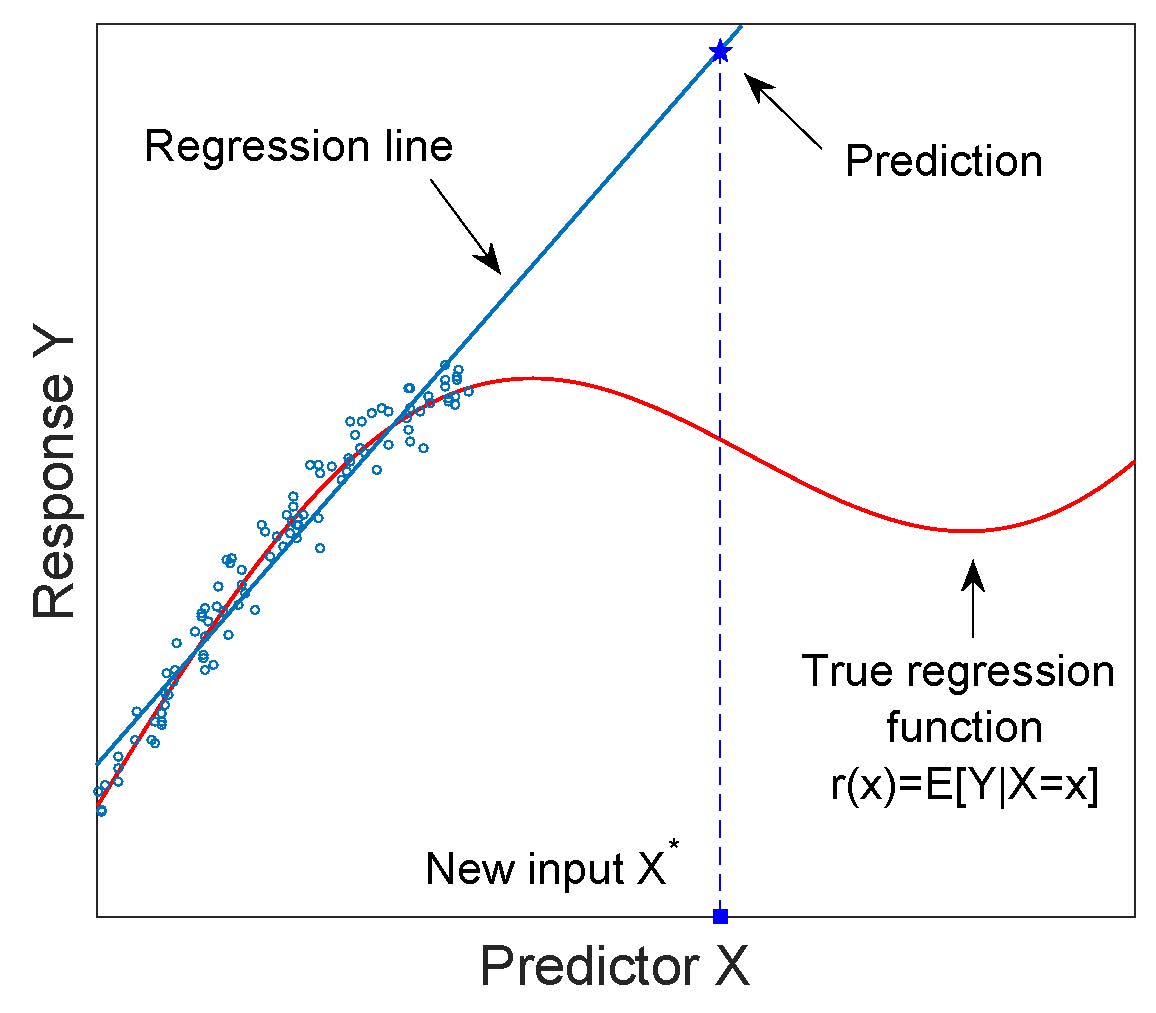
Using a regression line outside this range is called extrapolation and can be unreliable.
- The relationship may not continue beyond the observed data
- Predictions may be misleading
Linear Change of Variable
In some situations, variables other than \( x \) and \( y \) are used, or a linear change of variable is required.
A linear change of variable has the form
\( u = a + bx \)
This does not change the strength or direction of the linear relationship, only the scale and units.
Example :
A study investigates the relationship between the number of hours of exercise per week and resting heart rate.
Identify the explanatory and response variables.
▶️ Answer/Explanation
Hours of exercise are expected to influence heart rate.
Explanatory variable: number of hours of exercise per week
Response variable: resting heart rate
Conclusion: Exercise hours explain changes in heart rate.
Example :
A regression equation relating fuel cost \( C \) to distance travelled \( d \) is
\( C = 15 + 0.12d \)
Explain the meaning of the coefficient of \( d \).
▶️ Answer/Explanation
The coefficient of \( d \) represents the rate of change of fuel cost with distance.
Conclusion: For each additional unit of distance travelled, the fuel cost increases by 0.12 units.
Example :
A regression line is used to estimate the value of a response variable for an explanatory variable value outside the observed range.
Comment on the reliability of this estimate.
▶️ Answer/Explanation
This involves extrapolation.
Conclusion: The estimate may be unreliable because the relationship may not hold beyond the observed data.