The Product Moment Correlation Coefficient
The product moment correlation coefficient, usually denoted by \( r \), is a numerical measure that describes the strength and direction of the linear relationship between two variables.
Definition and Formula
The product moment correlation coefficient is defined by
\( r = \dfrac{\sum (x – \bar{x})(y – \bar{y})}{\sqrt{\sum (x – \bar{x})^2 \sum (y – \bar{y})^2}} \)
The value of \( r \) always satisfies
\( -1 \leq r \leq 1 \)
In practice, values of \( r \) are usually obtained using a calculator or statistical software. Derivations are not required.
Interpretation of \( r \)
| Value of \( r \) | Interpretation |
|---|---|
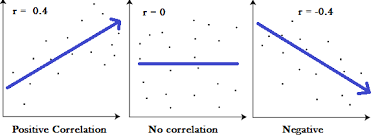
| \( r \approx 1 \) | Strong positive linear correlation |
| \( r \approx -1 \) | Strong negative linear correlation |
| \( r \approx 0 \) | Little or no linear correlation |
The closer \( r \) is to \( \pm 1 \), the stronger the linear relationship.
Use of the Correlation Coefficient
The correlation coefficient is used to:
- Measure the strength and direction of a linear relationship
- Support the use of a linear regression model
- Compare relationships between different data sets
Correlation should always be considered alongside a scatter diagram.
Limitations of the Correlation Coefficient
- It measures only linear relationships
- It can be strongly affected by outliers
- A high value of \( r \) does not imply causation
Tests of significance are not required in this syllabus.
Example :
The value of the product moment correlation coefficient for a data set is \( r = 0.86 \). Describe the relationship between the variables.
▶️ Answer/Explanation
The value of \( r \) is close to 1.
Conclusion: There is a strong positive linear correlation between the variables.
Example :
A data set has a correlation coefficient of \( r = -0.78 \). Explain what this tells you about the relationship between the variables.
▶️ Answer/Explanation
The value of \( r \) is negative and close to −1.
Conclusion: There is a strong negative linear relationship: as one variable increases, the other tends to decrease.
Example :
A scatter diagram shows a clear curved relationship between two variables, but the correlation coefficient is close to zero. Explain why this may occur.
▶️ Answer/Explanation
The correlation coefficient measures only linear relationships.
Conclusion: A strong non-linear relationship can exist even when \( r \) is close to zero.