Statistic and Sampling Distribution
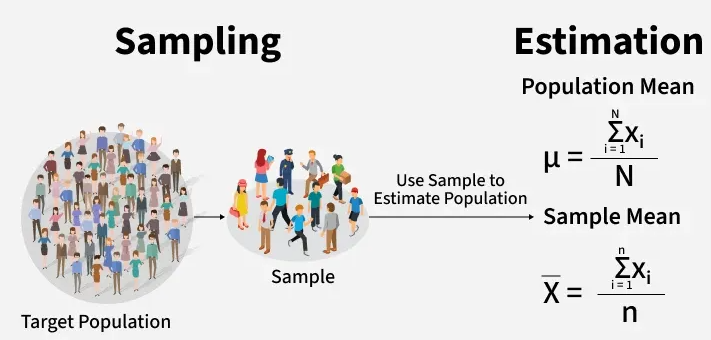
In statistical investigations, numerical values calculated from sample data are used to draw conclusions about a population. Two key ideas are the statistic and its sampling distribution.
Statistic
A statistic is a numerical value calculated from a sample.
It is used to estimate or describe a characteristic of the population.
Common Examples of Statistics
- Sample mean
- Sample median
- Sample proportion
- Sample variance
A statistic varies from sample to sample because different samples give different values.
Parameter and Statistic
A parameter is a numerical value that describes a population, whereas a statistic describes a sample.
Examples:
- Population mean \( \mu \) → parameter
- Sample mean \( \bar{x} \) → statistic
Sampling Distribution
The sampling distribution of a statistic is the probability distribution of that statistic over all possible samples of a fixed size taken from the population.
For example, the sampling distribution of the sample mean describes how the value of the sample mean varies from sample to sample.
Key Properties of a Sampling Distribution
Although individual data values may be variable, the sampling distribution has predictable properties.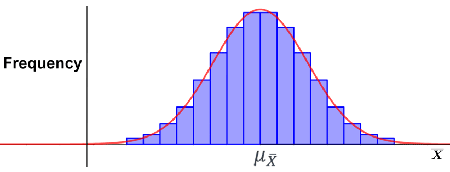
- It has its own mean and variance
- It describes the variability of the statistic
- It becomes more concentrated as sample size increases
For the sample mean:
- The mean of the sampling distribution is the population mean
- The spread decreases as the sample size increases
Why Sampling Distributions Are Important
Sampling distributions allow statisticians to:
- Measure how reliable a statistic is
- Understand the effect of sample size
- Make probabilistic statements about statistics
Key Point
- Clear distinction between population parameters and sample statistics
- Understanding that a statistic is a random variable
- Interpretation of variability using sampling distributions
Example :
A school wants to estimate the average time students spend studying each day. A random sample of 30 students is selected and the mean study time is calculated.
Identify:
(i) the statistic
(ii) the population parameter being estimated
▶️ Answer/Explanation
(i) Statistic: The sample mean study time of the 30 students
(ii) Population parameter: The true mean study time of all students in the school
Conclusion: The statistic is used to estimate the population mean.
Example :
Repeated random samples of size 50 are taken from a large population with mean \( \mu \).
Explain what is meant by the sampling distribution of the sample mean.
▶️ Answer/Explanation
The sampling distribution of the sample mean is the distribution of all possible values of the sample mean obtained from every possible random sample of size 50.
It shows how the sample mean varies from sample to sample.
Conclusion: Even though individual samples differ, their means follow a predictable distribution.
Example :
Two different random samples of the same size are taken from a population.
Explain why the values of a statistic calculated from each sample are likely to be different.
▶️ Answer/Explanation
Each sample contains different individuals from the population.
As a result, numerical summaries such as the mean or proportion will vary from sample to sample.
This variability is described by the sampling distribution of the statistic.
Conclusion: A statistic is a random variable, so its value changes from sample to sample.