Hypothesis Testing: Concepts and Interpretation
A hypothesis test is a formal statistical procedure used to make a decision about a population parameter based on sample data.
It provides a structured way to decide whether the data are consistent with a proposed mathematical model or whether there is evidence to suggest an alternative explanation.
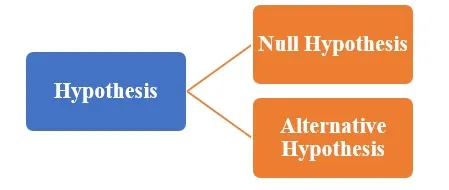
Null Hypothesis
The null hypothesis, denoted by \( \mathrm{H_0} \), represents the default or assumed position.
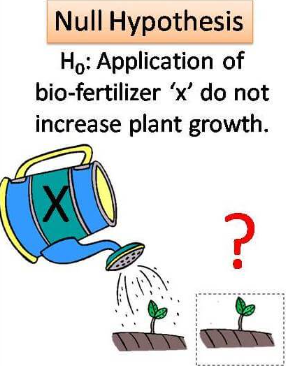
- It usually states that there is no effect, no change, or no difference
- It is the hypothesis that is tested directly
Examples:
\( \mathrm{H_0}:\; \mu = 50 \)
\( \mathrm{H_0}:\; p = 0.2 \)
Alternative Hypothesis
The alternative hypothesis, denoted by \( \mathrm{H_1} \), represents the claim being investigated.

- It contradicts the null hypothesis
- It is accepted when there is sufficient evidence against \( \mathrm{H_0} \)

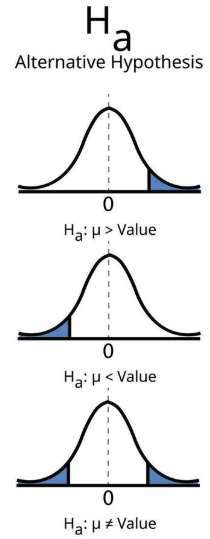
Forms of the Alternative Hypothesis:
Two-sided: \( \mathrm{H_1}:\; \mu \neq 50 \)
One-sided: \( \mathrm{H_1}:\; \mu > 50 \) or \( \mathrm{H_1}:\; \mu < 50 \)
Test Statistic and Evidence
A test statistic is calculated from the sample data and measures how far the data deviate from what is expected under \( \mathrm{H_0} \).
This value is compared with critical values or used to find a probability to decide whether the deviation is likely to have occurred by chance.
Decision and Interpretation
The outcome of a hypothesis test is one of the following:
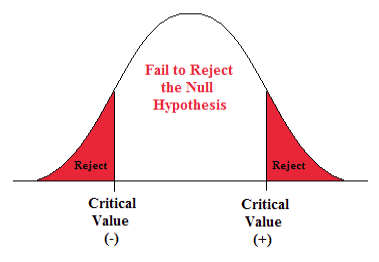
- Reject \( \mathrm{H_0} \): there is sufficient evidence in favour of \( \mathrm{H_1} \)
- Fail to reject \( \mathrm{H_0} \): there is insufficient evidence to support \( \mathrm{H_1} \)
Failing to reject \( \mathrm{H_0} \) does not prove that it is true. It simply means the data do not contradict it.
Hypothesis Testing and Mathematical Models
Hypothesis tests are often used to refine mathematical models.
A model proposes a value for a parameter, which is treated as the null hypothesis.
- If \( \mathrm{H_0} \) is rejected, the model may be inappropriate and should be revised
- If \( \mathrm{H_0} \) is not rejected, the model is consistent with the observed data
In this way, hypothesis testing provides an objective method for assessing and improving models.
Remember
- Always state both \( \mathrm{H_0} \) and \( \mathrm{H_1} \) clearly
- Interpret conclusions in the context of the problem
- Use correct language: “reject” or “fail to reject” \( \mathrm{H_0} \)
Example :
A manufacturer claims that 10% of the items produced are defective. A random sample of 50 items is taken and 9 are found to be defective.
Test the claim at the 5% significance level.
▶️ Answer/Explanation
Let \( X \) be the number of defective items in the sample.
Hypotheses:
\( \mathrm{H_0}:\; p = 0.10 \)
\( \mathrm{H_1}:\; p \neq 0.10 \)
Under \( \mathrm{H_0} \),
\( X \sim \mathrm{Bin}(50, 0.10) \)
Using binomial probabilities,
\( \mathrm{P}(X \geq 9) = 0.036 \) (from tables or calculation)
Since this probability is less than 0.05, the result is significant.
Conclusion: Reject \( \mathrm{H_0} \). There is sufficient evidence that the defect rate is not 10%.
Example :
The average number of customers entering a shop per hour is believed to be 6. During one particular hour, 11 customers enter the shop.
Test this observation at the 5% significance level.
▶️ Answer/Explanation
Let \( X \) be the number of customers in one hour.
Hypotheses:
\( \mathrm{H_0}:\; \lambda = 6 \)
\( \mathrm{H_1}:\; \lambda > 6 \)
Under \( \mathrm{H_0} \),
\( X \sim \mathrm{Po}(6) \)
Calculate the tail probability:
\( \mathrm{P}(X \geq 11) = 1 – \mathrm{P}(X \leq 10) = 0.042 \)
Since this probability is less than 0.05, the result is significant.
Conclusion: Reject \( \mathrm{H_0} \). There is evidence that the average number of customers per hour has increased.
Example :
A machine fills packets of rice. The manufacturer claims that the mean mass of the packets is 500 g. A random sample of 40 packets has a mean mass of 496 g. The population standard deviation is known to be 10 g.
Test the claim at the 5% significance level.
▶️ Answer/Explanation
Hypotheses:
\( \mathrm{H_0}:\; \mu = 500 \)
\( \mathrm{H_1}:\; \mu \neq 500 \)
Test statistic:
\( Z = \dfrac{496 – 500}{10/\sqrt{40}} = -2.53 \)
Critical value at 5% significance level (two-tailed):
\( \pm 1.96 \)
Since \( -2.53 < -1.96 \), the result is significant.
Conclusion: Reject \( \mathrm{H_0} \). The evidence suggests the model mean of 500 g should be refined.