One-Tailed and Two-Tailed Hypothesis Tests
In hypothesis testing, the form of the alternative hypothesis determines whether a test is one-tailed or two-tailed. This choice affects the location of the critical region and the interpretation of results.
One-Tailed Tests
A one-tailed test is used when the alternative hypothesis specifies a direction of departure from the null hypothesis.
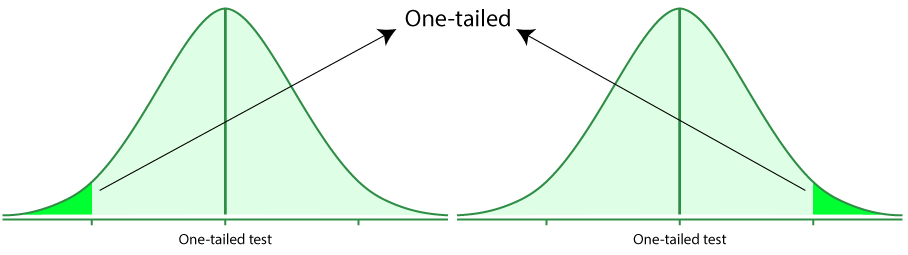
Only one extreme of the sampling distribution is considered.
Forms of One-Tailed Alternative Hypotheses
Upper-tailed test: \( \mathrm{H_1}:\; \mu > \mu_0 \)
Lower-tailed test: \( \mathrm{H_1}:\; \mu < \mu_0 \)
The entire significance level \( \alpha \) is placed in one tail of the distribution.
Example:
Testing whether a new process increases mean output
Two-Tailed Tests
A two-tailed test is used when the alternative hypothesis does not specify a direction.
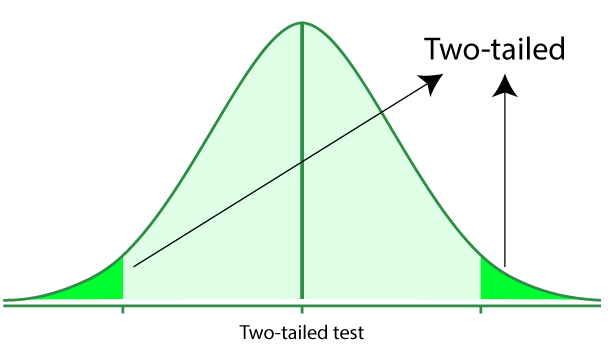
Departures in both directions from the null hypothesis are considered.
Form of Two-Tailed Alternative Hypothesis
\( \mathrm{H_1}:\; \mu \neq \mu_0 \)
The significance level \( \alpha \) is split equally between the two tails.
Example:
Testing whether a machine is correctly calibrated
Comparison of One-Tailed and Two-Tailed Tests
| Feature | One-Tailed Test | Two-Tailed Test |
|---|---|---|
| Alternative hypothesis | Directional | Non-directional |
| Critical region | One tail | Both tails |
| Significance level | All in one tail | Split equally |
Critical Values (Normal Distribution)
At the 5% significance level:
One-tailed test: critical value \( \mathrm{Z} = 1.645 \)
Two-tailed test: critical values \( \mathrm{Z} = \pm 1.96 \)
Choosing Between One-Tailed and Two-Tailed Tests
The choice must be made before data are collected.
- Use a one-tailed test only when deviations in one direction are meaningful
- Use a two-tailed test when deviations in either direction are important
Changing the test after seeing the data is not valid.
Examination Points
- The alternative hypothesis determines the type of test
- Always state whether the test is one-tailed or two-tailed
- Use the correct critical values
Example :
A manufacturer claims that the mean lifetime of a battery is 100 hours. A random sample of 25 batteries has a mean lifetime of 104 hours. The population standard deviation is known to be 10 hours.
Test the claim at the 5% significance level.
▶️ Answer/Explanation
Hypotheses:
\( \mathrm{H_0}:\; \mu = 100 \)
\( \mathrm{H_1}:\; \mu > 100 \)
Test statistic:
\( Z = \dfrac{104 – 100}{10/\sqrt{25}} = 2 \)
Critical value (upper-tailed, 5%):
\( Z = 1.645 \)
Since \( 2 > 1.645 \), the test statistic lies in the critical region.
Conclusion: Reject \( \mathrm{H_0} \). There is evidence that the mean battery life exceeds 100 hours.
Example:
A machine is designed to fill bags with an average mass of 2 kg. A sample of 36 bags has a mean mass of 1.94 kg. The population standard deviation is 0.12 kg.
Test whether the machine is under-filling at the 5% significance level.
▶️ Answer/Explanation
Hypotheses:
\( \mathrm{H_0}:\; \mu = 2.0 \)
\( \mathrm{H_1}:\; \mu < 2.0 \)
Test statistic:
\( Z = \dfrac{1.94 – 2.0}{0.12/\sqrt{36}} = -3 \)
Critical value (lower-tailed, 5%):
\( Z = -1.645 \)
Since \( -3 < -1.645 \), the result is significant.
Conclusion: Reject \( \mathrm{H_0} \). There is evidence that the machine is under-filling.
Example :
A light bulb manufacturer claims that the mean lifetime of bulbs is 1200 hours. A random sample of 64 bulbs has a mean lifetime of 1170 hours. The population standard deviation is 160 hours.
Test the claim at the 5% significance level.
▶️ Answer/Explanation
Hypotheses:
\( \mathrm{H_0}:\; \mu = 1200 \)
\( \mathrm{H_1}:\; \mu \neq 1200 \)
Test statistic:
\( Z = \dfrac{1170 – 1200}{160/\sqrt{64}} = -1.5 \)
Critical values (two-tailed, 5%):
\( Z = \pm 1.96 \)
Since \( -1.96 < -1.5 < 1.96 \), the test statistic does not lie in the critical region.
Conclusion: Fail to reject \( \mathrm{H_0} \). There is insufficient evidence that the mean lifetime differs from 1200 hours.