The Distribution of the Sample Mean
When a random sample is taken from a population, the sample mean \( \mathrm{\bar{X}} \) is itself a random variable. Understanding its distribution is essential for making inferences about the population mean.
Definition of the Sample Mean
For a random sample of size \( \mathrm{n} \) with observations \( \mathrm{X_1, X_2, \dots, X_n} \), the sample mean is defined as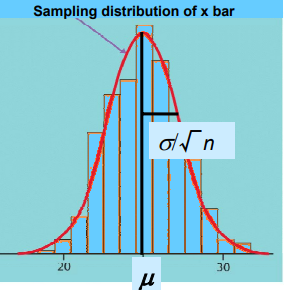
\( \mathrm{\bar{X} = \dfrac{1}{n}\sum_{i=1}^{n} X_i} \)
Since the sample observations are random variables, \( \mathrm{\bar{X}} \) is also a random variable.
Mean of the Sample Mean
The expected value of the sample mean is equal to the population mean:
\( \mathrm{E(\bar{X}) = \mu} \)
This means that \( \mathrm{\bar{X}} \) is an unbiased estimator of \( \mathrm{\mu} \).
Variance of the Sample Mean
The variance of the sample mean is given by
\( \mathrm{Var(\bar{X}) = \dfrac{\sigma^2}{n}} \)
As the sample size increases, the variance decreases, meaning the sample mean becomes more precise.
Distribution When the Population is Normal
If the population distribution is normal,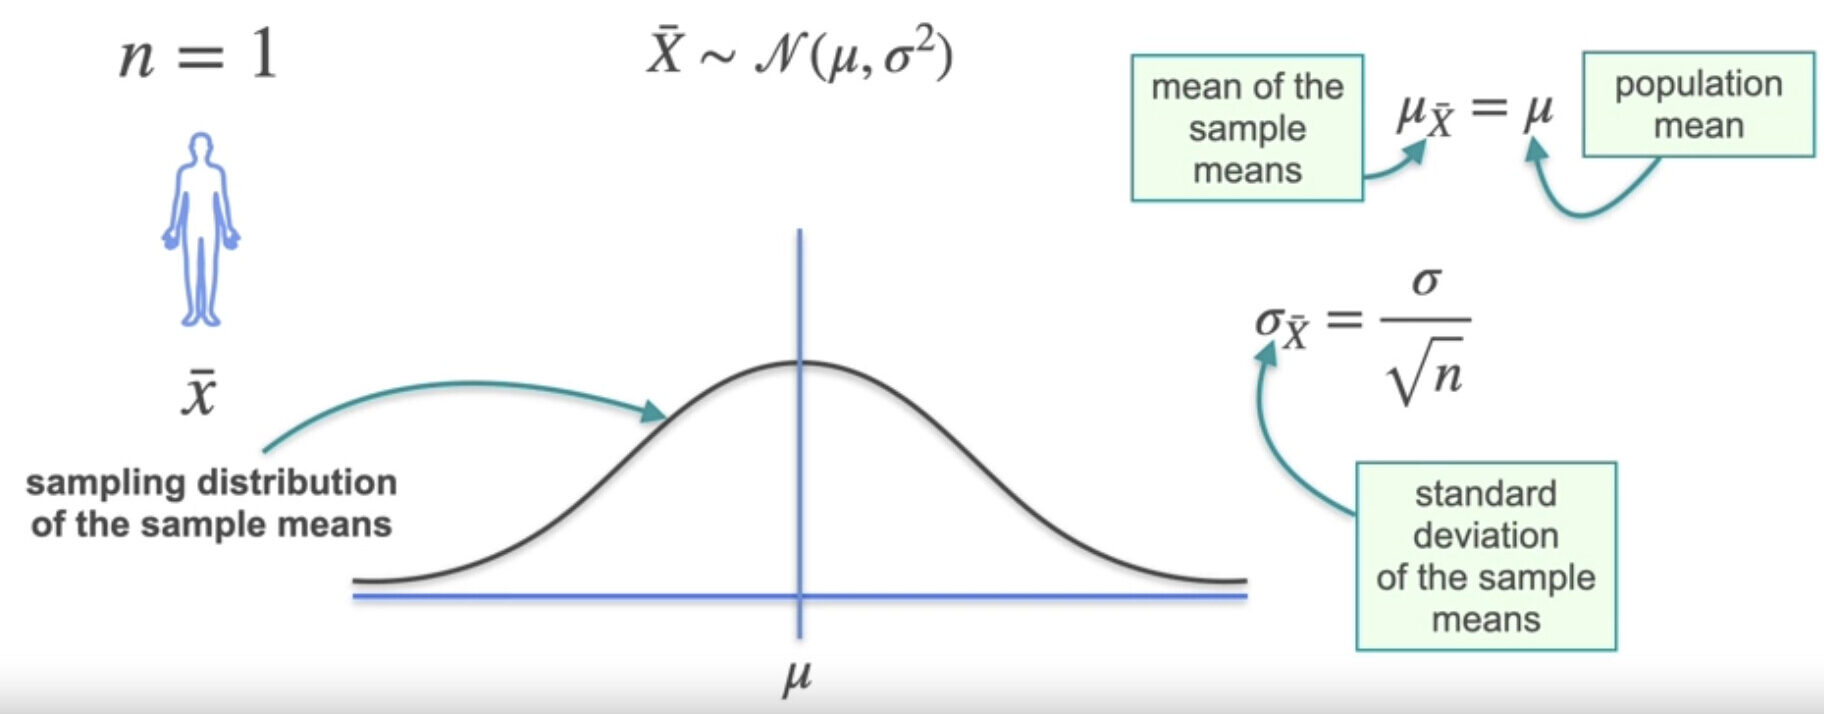
\( \mathrm{X \sim N(\mu,\,\sigma^2)} \)
then the distribution of the sample mean is also normal:
\( \mathrm{\bar{X} \sim N\!\left(\mu,\,\dfrac{\sigma^2}{n}\right)} \)
This result may be used directly. No proof is required.
Interpretation
- The sample mean has the same mean as the population
- The spread of the sample mean decreases as \( \mathrm{n} \) increases
- Larger samples give more reliable estimates of the population mean
Key Formula Summary
\( \mathrm{E(\bar{X}) = \mu} \)
\( \mathrm{Var(\bar{X}) = \sigma^2/n} \)
If \( \mathrm{X \sim N(\mu, \sigma^2)} \), then \( \mathrm{\bar{X} \sim N(\mu, \sigma^2/n)} \)
Example :
The lifetimes of batteries are normally distributed with mean \( \mathrm{\mu = 120} \) hours and standard deviation \( \mathrm{\sigma = 10} \) hours.
A random sample of \( \mathrm{n = 25} \) batteries is selected. Find the distribution of the sample mean lifetime.
▶️ Answer/Explanation
Since the population is normal, the sample mean is also normally distributed.
\( \mathrm{E(\bar{X}) = 120} \)
\( \mathrm{Var(\bar{X}) = \dfrac{10^2}{25} = 4} \)
Conclusion:
\( \mathrm{\bar{X} \sim N(120,\,4)} \)
Example :
The marks obtained by students in a test are normally distributed with mean \( \mathrm{60} \) and standard deviation \( \mathrm{8} \).
A random sample of \( \mathrm{n = 16} \) students is taken. Find the probability that the sample mean mark exceeds 62.
▶️ Answer/Explanation
For the sample mean:
\( \mathrm{E(\bar{X}) = 60} \)
\( \mathrm{Var(\bar{X}) = \dfrac{8^2}{16} = 4} \)
Standardise:
\( \mathrm{Z = \dfrac{62 – 60}{2} = 1} \)
Using normal tables:
\( \mathrm{P(\bar{X} > 62) = P(Z > 1) = 1 – 0.8413 = 0.1587} \)
Conclusion: The required probability is 0.1587.
Example :
A population has mean \( \mathrm{\mu} \) and standard deviation \( \mathrm{12} \).
A random sample of size \( \mathrm{n = 36} \) is taken. It is given that the standard deviation of the sample mean is 2.
Verify this result and comment on the effect of sample size.
▶️ Answer/Explanation
The variance of the sample mean is
\( \mathrm{Var(\bar{X}) = \dfrac{12^2}{36} = 4} \)
So the standard deviation is
\( \mathrm{\sqrt{4} = 2} \)
Conclusion: The result is verified. Increasing the sample size reduces the spread of the sample mean, making estimates more precise.