Confidence Intervals
A confidence interval is a range of values that is used to estimate an unknown population parameter, such as the population mean. It is constructed from sample data and gives an indication of the reliability of the estimate.
Concept of a Confidence Interval 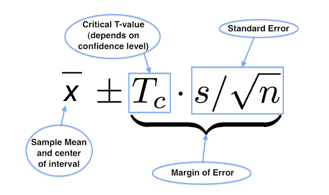
A confidence interval for a population mean \( \mathrm{\mu} \) has the general form
\( \mathrm{estimate \pm margin\ of\ error} \)
For large samples or when the population standard deviation is known, a confidence interval for the mean is based on the sample mean \( \mathrm{\bar{X}} \).
Interpretation of a Confidence Interval
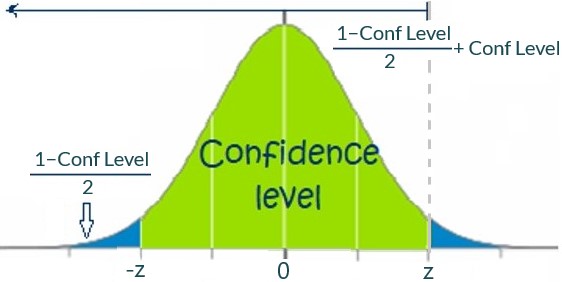
A confidence interval with confidence level \( \mathrm{(1-\alpha)\times100\%} \) means that:
If many random samples were taken and a confidence interval calculated from each, then approximately \( \mathrm{(1-\alpha)\times100\%} \) of those intervals would contain the true population parameter
It does not mean that there is a probability of \( \mathrm{(1-\alpha)} \) that the parameter lies in the particular interval calculated.
Confidence Interval for a Population Mean
If the population is normally distributed (or the sample size is sufficiently large), a confidence interval for the mean is given by
\( \mathrm{\bar{X} \pm z_{\alpha/2}\dfrac{\sigma}{\sqrt{n}}} \)
where:
\( \mathrm{z_{\alpha/2}} \) is the critical value from the standard normal distribution
\( \mathrm{\sigma/\sqrt{n}} \) is the standard error of the mean
Common confidence levels are 90%, 95%, and 99%.
Effect of Sample Size and Confidence Level
- Increasing the sample size reduces the width of the confidence interval
- Increasing the confidence level increases the width of the confidence interval
There is a trade-off between precision and confidence.
Link with Hypothesis Tests
Confidence intervals are closely related to hypothesis testing.
For a two-tailed hypothesis test at significance level \( \mathrm{\alpha} \):
The null hypothesis value of the parameter lies inside the \( \mathrm{(1-\alpha)\times100\%} \) confidence interval if and only if the null hypothesis is not rejected
The null hypothesis value lies outside the confidence interval if and only if the null hypothesis is rejected
Thus, confidence intervals provide an alternative way of presenting the result of a hypothesis test.
Key Points to Remember
- A confidence interval estimates an unknown population parameter
- The confidence level reflects the long-run success rate of the method
- Confidence intervals and hypothesis tests give consistent conclusions
Example :
A random sample of size \( \mathrm{n = 36} \) is taken from a normal population with known standard deviation \( \mathrm{\sigma = 12} \).
The sample mean is \( \mathrm{\bar{x} = 50} \).
Find a 95% confidence interval for the population mean \( \mathrm{\mu} \).
▶️ Answer/Explanation
For a 95% confidence interval,
\( \mathrm{z_{0.025} = 1.96} \)
Standard error:
\( \mathrm{\dfrac{12}{\sqrt{36}} = 2} \)
Confidence interval:
\( \mathrm{50 \pm 1.96(2)} \)
\( \mathrm{50 \pm 3.92} \)
Conclusion: The 95% confidence interval is \( \mathrm{(46.08,\;53.92)} \).
Example :
A 99% confidence interval for a population mean \( \mathrm{\mu} \) is given as
\( \mathrm{(18,\;22)} \)
State whether the null hypothesis \( \mathrm{H_0:\mu = 20} \) would be rejected at the 1% significance level.
▶️ Answer/Explanation
The null hypothesis value \( \mathrm{20} \) lies within the confidence interval.
For a two-tailed test, this means the null hypothesis is not rejected.
Conclusion: There is insufficient evidence to reject \( \mathrm{H_0} \) at the 1% significance level.
Example :
A confidence interval for a population mean is required to be narrower.
Explain how this could be achieved, and comment on the effect on confidence.
▶️ Answer/Explanation
The width of a confidence interval can be reduced by:
Increasing the sample size \( \mathrm{n} \)
Using a lower confidence level
However, reducing the confidence level decreases the long-run reliability of the interval.
Conclusion: There is a trade-off between precision and confidence.