Confidence Limits for a Normal Mean (Variance Known)
When data are taken from a normally distributed population and the population variance is known, confidence limits can be calculated for the population mean using the normal distribution.
In this syllabus, the emphasis is on application: using the standard error and normal distribution tables to obtain confidence intervals, rather than on theoretical derivations.
Assumptions
The following conditions apply:
- The population distribution is normal
- The population variance \( \mathrm{\sigma^2} \) is known
- A random sample of size \( \mathrm{n} \) is taken
Standard Error of the Mean
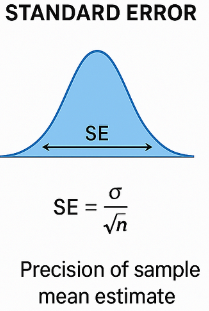
For a sample mean \( \mathrm{\bar{X}} \), the standard error is
\( \mathrm{SE(\bar{X}) = \dfrac{\sigma}{\sqrt{n}}} \)
This measures the variability of the sample mean from sample to sample.
Confidence Interval for the Mean
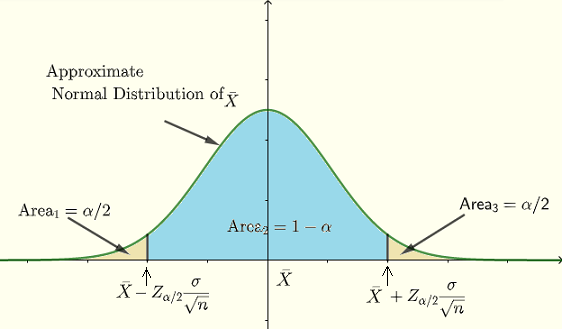
A \( \mathrm{(1-\alpha)\times100\%} \) confidence interval for the population mean \( \mathrm{\mu} \) is given by
\( \mathrm{\bar{X} \pm z_{\alpha/2}\dfrac{\sigma}{\sqrt{n}}} \)
where \( \mathrm{z_{\alpha/2}} \) is the critical value from the standard normal distribution.
Common Confidence Levels
90% confidence: \( \mathrm{z_{0.05} = 1.645} \)
95% confidence: \( \mathrm{z_{0.025} = 1.96} \)
99% confidence: \( \mathrm{z_{0.005} = 2.576} \)
These values are obtained from the standard normal distribution tables.
Confidence Limits
The lower confidence limit and upper confidence limit are given by: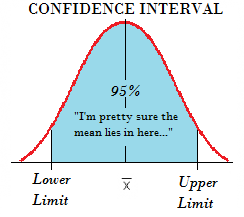
Lower limit: \( \mathrm{\bar{X} – z_{\alpha/2}\dfrac{\sigma}{\sqrt{n}}} \)
Upper limit: \( \mathrm{\bar{X} + z_{\alpha/2}\dfrac{\sigma}{\sqrt{n}}} \)
Together, these form the confidence interval for \( \mathrm{\mu} \).
Interpretation
The interval gives a range of plausible values for the population mean
- Higher confidence leads to a wider interval
- Larger samples produce narrower intervals
No derivation of the formula is required.
Link with Hypothesis Testing
For a two-tailed test at significance level \( \mathrm{\alpha} \):
- If the hypothesised mean lies inside the \( \mathrm{(1-\alpha)\times100\%} \) confidence interval, the null hypothesis is not rejected
- If it lies outside the interval, the null hypothesis is rejected
Example :
A random sample of size \( \mathrm{n = 64} \) is taken from a normal population with known standard deviation \( \mathrm{\sigma = 8} \).
The sample mean is \( \mathrm{\bar{x} = 52} \).
Find the 95% confidence limits for the population mean \( \mathrm{\mu} \).
▶️ Answer/Explanation
For 95% confidence, \( \mathrm{z_{0.025} = 1.96} \).
Standard error:
\( \mathrm{SE(\bar{X}) = \dfrac{8}{\sqrt{64}} = 1} \)
Confidence limits:
\( \mathrm{52 \pm 1.96(1)} \)
\( \mathrm{(50.04,\;53.96)} \)
Conclusion: The 95% confidence interval for \( \mathrm{\mu} \) is \( \mathrm{(50.04,\;53.96)} \).
Example :
The mean filling time of bottles is estimated using a random sample of size \( \mathrm{n = 25} \).
The sample mean is \( \mathrm{\bar{x} = 10.5} \) seconds and the population standard deviation is known to be \( \mathrm{\sigma = 1.5} \) seconds.
Construct a 99% confidence interval for the population mean filling time.
▶️ Answer/Explanation
For 99% confidence, \( \mathrm{z_{0.005} = 2.576} \).
Standard error:
\( \mathrm{\dfrac{1.5}{\sqrt{25}} = 0.3} \)
Confidence limits:
\( \mathrm{10.5 \pm 2.576(0.3)} \)
\( \mathrm{10.5 \pm 0.7728} \)
\( \mathrm{(9.73,\;11.27)} \)
Conclusion: The 99% confidence interval is \( \mathrm{(9.73,\;11.27)} \).
Example :
A 95% confidence interval for a population mean \( \mathrm{\mu} \) is calculated as
\( \mathrm{(32.1,\;35.9)} \)
State, with a reason, whether the null hypothesis \( \mathrm{H_0:\mu = 36} \) would be rejected at the 5% significance level.
▶️ Answer/Explanation
The hypothesised value \( \mathrm{36} \) lies outside the 95% confidence interval.
For a two-tailed test at the 5% level, this means the null hypothesis is rejected.
Conclusion: There is sufficient evidence to reject \( \mathrm{H_0} \) at the 5% significance level.