Hypothesis Tests for the Mean of a Normal Distribution (Variance Known)
Hypothesis testing is a formal procedure used to decide whether there is sufficient evidence from sample data to support a claim about a population parameter. In this section, we consider tests for the population mean when the population variance is known and the population is normally distributed.
Assumptions
The following conditions apply:
- The population distribution is normal
- The population variance \( \mathrm{\sigma^2} \) is known
- A random sample of size \( \mathrm{n} \) is taken
Null and Alternative Hypotheses
A hypothesis test begins with two competing hypotheses:
Null hypothesis \( \mathrm{H_0} \): the population mean has a specified value
Alternative hypothesis \( \mathrm{H_1} \): the population mean differs from the value in \( \mathrm{H_0} \)
Common forms of the alternative hypothesis are:
Two-tailed: \( \mathrm{H_1:\mu \neq \mu_0} \)
Upper-tailed: \( \mathrm{H_1:\mu > \mu_0} \)
Lower-tailed: \( \mathrm{H_1:\mu < \mu_0} \)
Test Statistic
The test statistic used is
\( \mathrm{Z = \dfrac{\bar{X} – \mu_0}{\sigma/\sqrt{n}}} \)
Under the null hypothesis, this statistic has the distribution
\( \mathrm{Z \sim N(0,1)} \)
Significance Level
The significance level, denoted by \( \mathrm{\alpha} \), is the probability of rejecting the null hypothesis when it is true.
Common significance levels are:
5% (\( \mathrm{\alpha = 0.05} \))
1% (\( \mathrm{\alpha = 0.01} \))
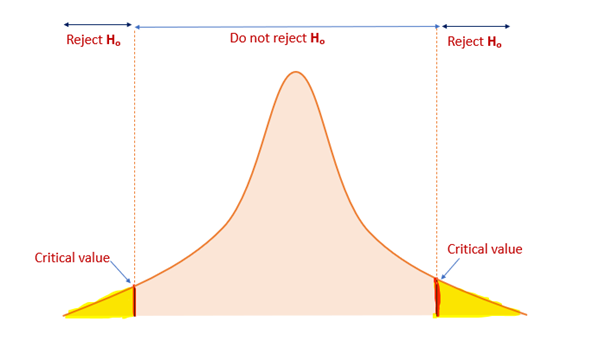
Critical Region Method
Using the critical region approach:
For a two-tailed test at 5% level: reject \( \mathrm{H_0} \) if \( \mathrm{|Z| > 1.96} \)
For an upper-tailed test at 5% level: reject \( \mathrm{H_0} \) if \( \mathrm{Z > 1.645} \)
For a lower-tailed test at 5% level: reject \( \mathrm{H_0} \) if \( \mathrm{Z < -1.645} \)
p-value Method
Alternatively, the p-value may be used.
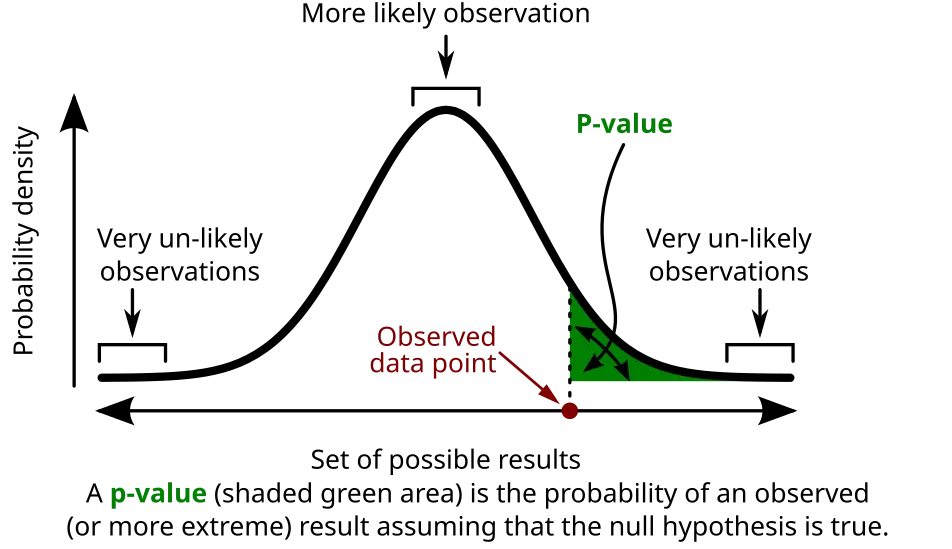
The p-value is the probability of obtaining a test statistic at least as extreme as the observed value, assuming \( \mathrm{H_0} \) is true
Reject \( \mathrm{H_0} \) if the p-value is less than \( \mathrm{\alpha} \)
Link with Confidence Intervals
For a two-tailed test at significance level \( \mathrm{\alpha} \):
Reject \( \mathrm{H_0} \) if the hypothesised mean \( \mathrm{\mu_0} \) lies outside the \( \mathrm{(1-\alpha)\times100\%} \) confidence interval
Do not reject \( \mathrm{H_0} \) if it lies inside the interval
Key Points to Remember
- The test statistic follows \( \mathrm{N(0,1)} \) under \( \mathrm{H_0} \)
- Known variance allows direct use of the normal distribution
- Decisions are based on critical values or p-values
Example :
The mean length of metal rods is claimed to be \( \mathrm{50\;cm} \). The population standard deviation is known to be \( \mathrm{4\;cm} \).
A random sample of \( \mathrm{n = 36} \) rods has a mean length of \( \mathrm{51.2\;cm} \).
Test the claim at the 5% significance level.
▶️ Answer/Explanation
Step 1: Hypotheses
\( \mathrm{H_0:\mu = 50} \)
\( \mathrm{H_1:\mu \neq 50} \)
Step 2: Test statistic
\( \mathrm{Z = \dfrac{51.2 – 50}{4/\sqrt{36}} = 1.8} \)
Step 3: Critical value
At 5% level, \( \mathrm{|Z| > 1.96} \) is the rejection region
Decision: \( \mathrm{1.8 < 1.96} \), so do not reject \( \mathrm{H_0} \).
Conclusion: There is insufficient evidence at the 5% level to suggest the mean length differs from 50 cm.
Example :
The mean time taken to complete a task is believed to be \( \mathrm{30\;minutes} \). The population standard deviation is \( \mathrm{6\;minutes} \).
A random sample of \( \mathrm{n = 25} \) tasks has a mean time of \( \mathrm{33\;minutes} \).
Test at the 5% significance level whether the mean time has increased.
▶️ Answer/Explanation
Step 1: Hypotheses
\( \mathrm{H_0:\mu = 30} \)
\( \mathrm{H_1:\mu > 30} \)
Step 2: Test statistic
\( \mathrm{Z = \dfrac{33 – 30}{6/\sqrt{25}} = 2.5} \)
Step 3: Critical value
Upper-tailed 5% test: reject if \( \mathrm{Z > 1.645} \)
Decision: \( \mathrm{2.5 > 1.645} \), so reject \( \mathrm{H_0} \).
Conclusion: There is sufficient evidence at the 5% level to conclude that the mean time has increased.
Example :
A manufacturer claims that the mean mass of packets is \( \mathrm{500\;g} \). The population standard deviation is \( \mathrm{5\;g} \).
A random sample of \( \mathrm{n = 100} \) packets has a mean mass of \( \mathrm{498.8\;g} \).
Test the claim at the 1% significance level.
▶️ Answer/Explanation
Step 1: Hypotheses
\( \mathrm{H_0:\mu = 500} \)
\( \mathrm{H_1:\mu \neq 500} \)
Step 2: Test statistic
\( \mathrm{Z = \dfrac{498.8 – 500}{5/\sqrt{100}} = -2.4} \)
Step 3: Critical value
At 1% level, reject if \( \mathrm{|Z| > 2.576} \)
Decision: \( \mathrm{|−2.4| < 2.576} \), so do not reject \( \mathrm{H_0} \).
Conclusion: There is insufficient evidence at the 1% level to conclude that the mean mass differs from 500 g.