Spearman’s Rank Correlation Coefficient
Spearman’s rank correlation coefficient is a non-parametric measure of association between two variables. It assesses how well the relationship between two variables can be described using a monotonic relationship.
It is particularly useful when:
- Data are not normally distributed
- Data are ordinal or based on ranks
- Outliers may distort Pearson’s correlation
Definition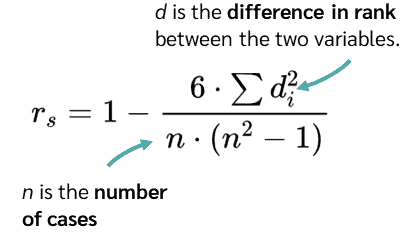
If two variables \( \mathrm{X} \) and \( \mathrm{Y} \) are ranked, the Spearman’s rank correlation coefficient is defined as
\( \mathrm{r_s = 1 – \dfrac{6\sum d^2}{n(n^2 – 1)}} \)
where:
\( \mathrm{n} \) = number of paired observations
\( \mathrm{d} \) = difference between the ranks of each pair
Interpretation of \( \mathrm{r_s} \)
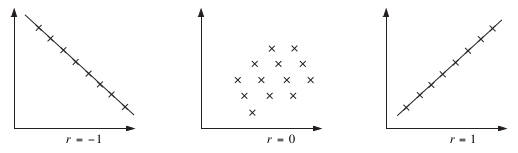
- \( \mathrm{r_s = 1} \): perfect positive association
- \( \mathrm{r_s = -1} \): perfect negative association
- \( \mathrm{r_s = 0} \): no monotonic association
The closer \( \mathrm{r_s} \) is to \( \pm 1 \), the stronger the association.
Use of Spearman’s Rank
- Measures strength and direction of a monotonic relationship
- Does not assume linearity
- Less sensitive to outliers than Pearson’s correlation
Ties in Ranks
A tie occurs when two or more observations have the same value.
When ties occur:
- Assign the average of the ranks that would have been occupied
- Continue the ranking using the next available rank
Numerical examination questions involving ties will not be set, but students are expected to understand how ties are handled.
Limitations
- Only measures monotonic relationships
- Does not measure the rate of change
- Correlation does not imply causation
Example 1:
The following data give ranks for two variables:
X ranks: 1, 2, 3, 4, 5
Y ranks: 2, 1, 4, 3, 5
Find Spearman’s rank correlation coefficient.
▶️ Answer/Explanation
Differences in ranks \( \mathrm{d} \):
−1, 1, −1, 1, 0
Squares:
1, 1, 1, 1, 0
\( \mathrm{\sum d^2 = 4} \), \( \mathrm{n = 5} \)
\( \mathrm{r_s = 1 – \dfrac{6(4)}{5(25 – 1)} = 0.8} \)
Conclusion: There is a strong positive association.
Example :
The Spearman’s rank correlation coefficient between test score rank and revision time rank is calculated as \( \mathrm{r_s = -0.92} \).
Interpret this value.
▶️ Answer/Explanation
The value is close to −1.
Conclusion: There is a very strong negative monotonic relationship. As one variable increases, the other tends to decrease.
Example :
Two students receive the same mark in a test and would occupy ranks 3 and 4.
State the ranks assigned and explain why.
▶️ Answer/Explanation
The tied values are each assigned the average rank:
\( \mathrm{\dfrac{3 + 4}{2} = 3.5} \)
Conclusion: Both observations receive rank 3.5 to reflect the tie fairly.