[MAI 4.4] LINEAR REGRESSION-manav-ready
Question
[Maximum mark: 7]
Consider the following data
(a) Find the correlation coefficient r. [1]
(b) Describe the relation between x and y. [2]
(c) Find the equation y = ax+b of the regression line for y on x. [2]
(d) Describe what the coefficient a represents. [1]
(e) Describe what the constant b represents. [1]
▶️Answer/Explanation
Ans:
(a) 0.965
(b) strong positive
(c) y = 2.2x – 0.5
(d) whenever x increases by 1 unit, y increases by 2.2 units.
(e) The value of y corresponding to 0 units of x.
Question
[Maximum mark: 6]
Consider the following data
The regression line for y on x is y = 2.2x – 0.5
(a) Solve the equation above for x to find an expression in the form x = ay+b [2]
(b) Find the equation x = cy+d of the regression line for x on y. [2]
(c) Describe the advantage of the linear equation in (b). [2]
▶️Answer/Explanation
Ans:
(a) y = 2.2x – 0.5 ⇔ y + 0.5 = 2.2x ⇔ x = 0.455 y + 0.227
(b) x = 0.423y + 0.385
(c) The relation in (a) is in fact the inverse function of the line y = 2.2x – 0.5
If y is given, the answer in (c) gives a more reliable estimation of x.
Question
[Maximum mark: 4]
Consider the following data
(a) Find Spearman’s rank correlation coefficient rs. [2]
(b) Describe the meaning of this coefficient. [2]
▶️Answer/Explanation
Ans:
(a) rs = 1.
(b) It describes the monotonic relationship of the data. When x increases y also increases.
Question
[Maximum mark: 4]
Statements I, II, III, IV and V represent descriptions of the correlation between two variables.
I High positive linear correlation
II Low positive linear correlation
III No correlation
IV Low negative linear correlation
V High negative linear correlation
Which statement best represents the relationship between the two variables shown in each of the scatter diagrams below.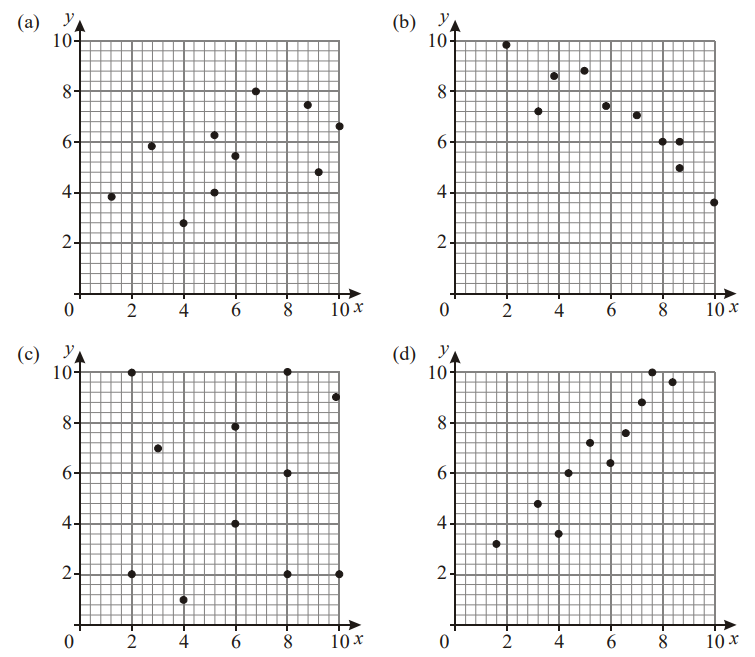
▶️Answer/Explanation
Ans:
(a) II
(b) V
(c) III
(d) I
Question
[Maximum mark: 7]
The sketches below represent scatter diagrams for the way in which variables x, y and z change over time, t, in a given chemical experiment.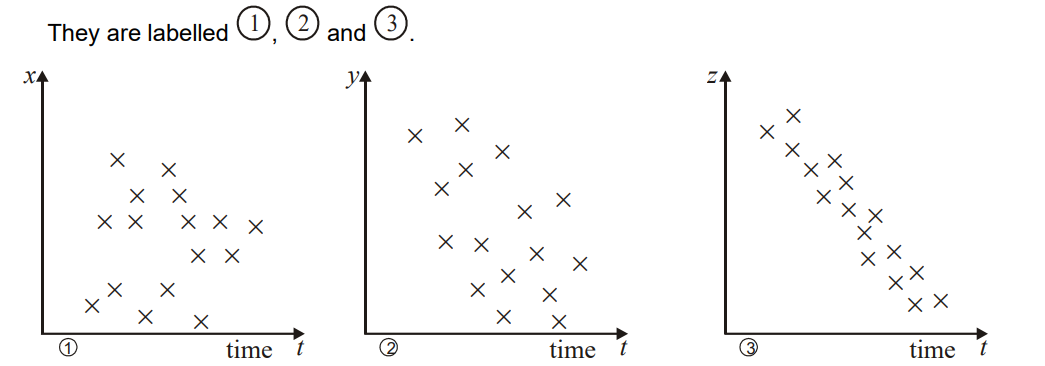
(a) State which of the diagrams indicate that the pair of variables
(i) is not correlated. (ii) shows strong linear correlation. [2]
(b) A student is given a piece of paper with five numbers written on it. She is told that three of these numbers are the product moment correlation coefficients for the three pairs of variables shown above. The five numbers are
0.9, –0.85, –0.20, 0.04, 1.60
(i) For each sketch above state which of these five numbers is the most appropriate value for the correlation coefficient. [3]
(ii) For the two remaining numbers, state why you reject them for this experiment. [2]
▶️Answer/Explanation
Ans:
(a) (I) 1 (ii) 3
(b) (I) 1 0.04 2 -0.20 3 -0.85
(ii) 1.60 A product–moment correlation coefficient cannot be > 1.
0.90 There is no diagram with a strong positive correlation.
Question
[Maximum mark: 4]
The length and width of 10 leaves are shown on the scatter diagram below.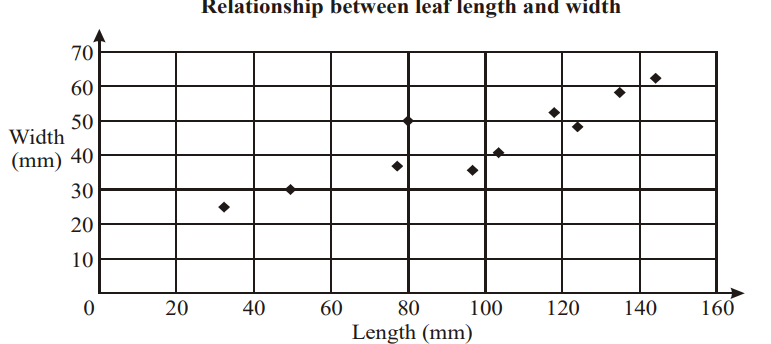 (a) Plot the point M(97, 43) which represents the mean length and the mean width. [1]
(b) Draw a suitable line of best fit. [2]
(c) Write a sentence describing the relationship between leaf length and leaf width for this sample. [1]
▶️Answer/Explanation
Ans:
(a) (see diagram)
(b)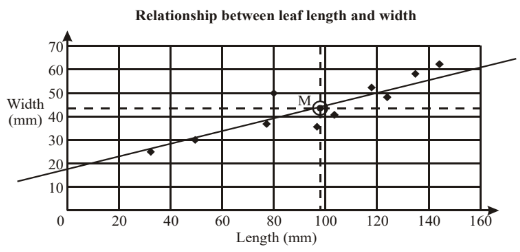 (c) leaf length and leaf width are positively correlated
Question
[Maximum mark: 5]
Ten students were asked for their average grade at the end of their last year of high school and their average grade at the end of their last year at university. The results were put into a table as follows: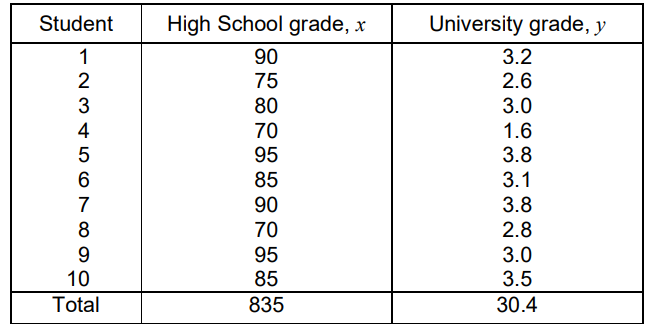
(a) Find the correlation coefficient r. [1]
(b) Describe the correlation between the high school and the university grades. [2]
(c) Find the equation of the regression line for y on x. [2]
▶️Answer/Explanation
Ans:
(a) r = 0.76
(b) Fairly strong positive correlation between high school grades and university grades
(c) y = 0.052x – 1.29 (3 s.f.)
Question
[Maximum mark: 6]
Eight students in Mr. O’Neil’s Physical Education class did pushups and situps. Their results are shown in the following table.
The graph below shows the results for the first seven students.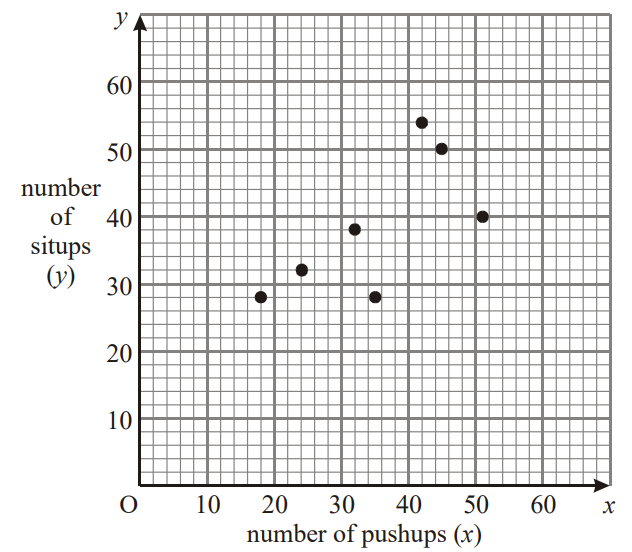
(a) Plot the results for the eighth student on the graph. [1]
(b) Find \(\bar{x}\) and \(\bar{y}\), and draw a line of best fit on the graph. [4]
(c) A student can do 60 pushups. How many situps can the student be expected to do? [1]
▶️Answer/Explanation
Ans:
(a) On the graph
(b) \(\bar{x}=34\) and \(\bar{y}=40\)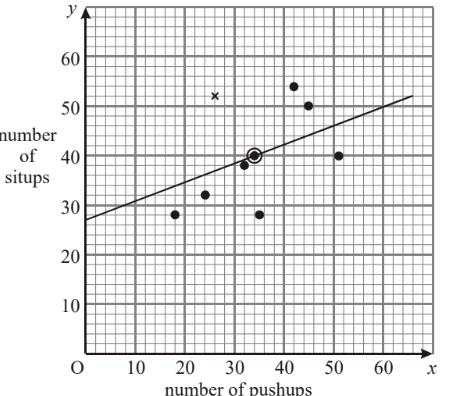
(c) 50 situps (allow ±2) (ft from candidate’s graph)
Question
[Maximum mark: 4]
Ten students were given two tests, one on Mathematics and one on English. The table shows the results of the tests for each of the ten students. (a) Find correct to two decimal places, the correlation coefficient (r). [2]
(b) Use your result from part (a) to comment on the statement:
‘Those who do well in Mathematics also do well in English. [2]
▶️Answer/Explanation
Ans:
(a) r = 0.6399706… \(\approx\) 0.64 (2 d.p.)
(b) This indicates that there is a degree of positive correlation between scores in Mathematics and scores in English.
Therefore those who do well in Mathematics are likely to do well in English also. (Or equivalent statements.)
Question
[Maximum mark: 12]
Consider the following data![]()
(a) Find the Pearson correlation coefficient r. [1]
(b) Describe the relation between x and y. [2]
(c) Find the equation y = ax+b of the regression line for y on x. [2]
(d) Find the equation x = cy+d of the regression line for x on y. [2]
(e) Find the Spearman rank correlation coefficient rs [3]
(f) Describe the difference between the two correlation coefficients. [2]
▶️Answer/Explanation
Ans:
(a) r = 0.929
(b) strong positive
(c) y = 0.929 x +10.3
(d) x = 0.929 y – 9
(e) ranks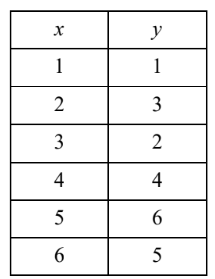 rs = 0.886
(f) r = 0.929 indicates the degree of linear relationship between x and y (strong positive) rs = 0.886 indicates the degree of monotonic relationship between x and y (in what extent y increases when x increases)
Question
[Maximum mark: 12]
The following table gives the amount of fuel in a car’s fuel tank, and the number of kilometres travelled after filling the tank. (a) On the scatter diagram below, plot the remaining points. [2]
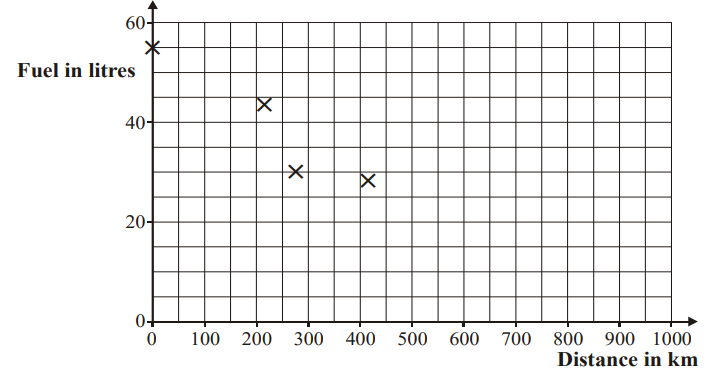
The mean distance travelled is 421 km ( \(\bar{x}\) ), and the mean amount of fuel in the tank is 28 litres ( \(\bar{y}\) ). This point is plotted on the scatter diagram.
(b) Sketch the line of best fit. [3]
(c) A car travelled 350km. Use your line above to estimate the amount of fuel left in the tank. [1]
(d) Find the Pearson correlation coefficient r. [2]
(e) Find the Spearman rank correlation coefficient rs. [2]
(f) Describe the difference between the two correlation coefficients. [2]
▶️Answer/Explanation
Ans:
(a)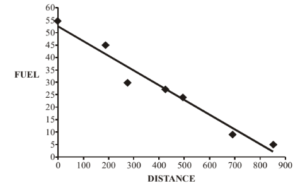
2 marks for all 3 points correct. Only 1 mark for 2 points correct
(b) Straight line with negative gradient passing through the mean intercept on y-axis between 50 and 55
(c) 32 (read answer from candidate’s line)
(d) r = – 0.978
(e) ranks
x 1 2 3 4 5 6
y 6 5 4 3 2 1
rs = –1
(f) r = – 0.978 indicates the degree of linear relationship between x and y (strong negative) rs = –1 indicates a perfect negative monotonic relationship between x and y (y decreases when x increases)
