Question
Most-appropriate topic codes (IB Biology Guide 2025):
• Topic A4.1: Evolution and speciation — part (b)
▶️ Answer/Explanation
(a)
The EDGE of Existence programme (Evolutionarily Distinct and Globally Endangered) aims to: – Prioritize globally endangered species for conservation. – Identify species that are evolutionarily distinct/have few close relatives. – Focus on species important for maintaining biodiversity. – Work at grassroots/local levels to implement conservation.
Example: Chinese Giant Salamander, Pangolins, or Aye-aye.
✅ Answer: Any two valid points for full marks.
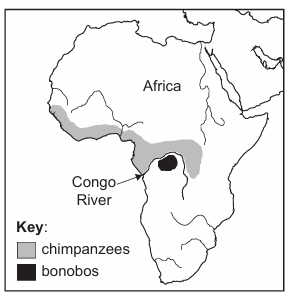
(b)
The speciation process likely occurred as follows: 1. A later rise in the Congo River level created geographical isolation between the populations north and south of the river. 2. This led to reproductive isolation with no gene flow between the separated populations. 3. The populations experienced different selective pressures/environments on either side of the river. 4. Different adaptations were favored by natural selection in each population, leading to differential survival and reproduction. 5. Over time, the populations diverged genetically and can no longer interbreed even if the geographical barrier were removed.
✅ Answer: Any three valid points for full marks.