▶️ Answer/Explanation
Detailed solution
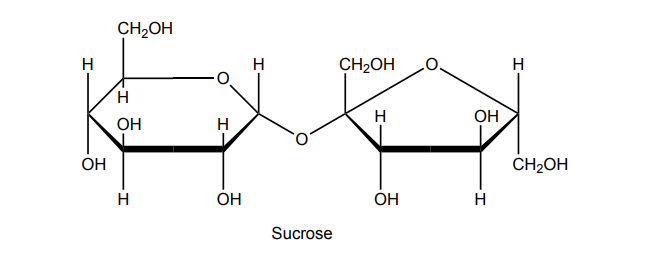
(a)
The reaction is hydrolysis, a catabolic process that breaks chemical bonds using water.
(b)
Capillaries support nutrient exchange because:
• Their walls are only one cell thick, providing a very short diffusion distance.
• They create large surface areas through extensive branching networks.
• Many capillaries contain fenestrations (small openings) that allow molecules to move across more quickly.
(c)
Facilitated diffusion is passive and moves molecules down their concentration gradient. Fructose crosses the membrane using specific carrier or channel proteins that bind to it and help it pass through the phospholipid bilayer without requiring ATP.