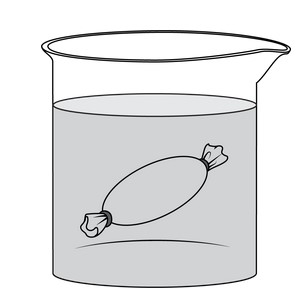
Home / IB DP Biology B2.2 Organelles and compartmentalization-FA 2025- Question Bank SL Paper 1

IB DP Biology B2.2 Organelles and compartmentalization-FA 2025- Question Bank SL Paper 1

Question

Figure 1

A student is using dialysis bags to model the effects of changing solute concentrations on cells. The student places one dialysis bag that contains 25 mL

of distilled water into each of two beakers that are filled with 200 mL of distilled water. (Figure 1). The membrane of each dialysis bag membrane contains pores that allow small solutes such as monoatomic ions to pass through but are too small for anything larger to pass. After 30 minutes, 5 mL

of a concentrated solution of albumin (a medium-sized, water-soluble protein) is added to one of the two beakers. Nothing is added to the other beaker. After two more hours at room temperature, the mass of each bag is determined. There is no change in the mass of the dialysis bag in the beaker to which no albumin was added.

Which of the graphs below best represents the predicted change in mass over time of the dialysis bag in the beaker to which albumin was added?

A.


The figure presents a graph in the coordinate plane. The horizontal axis is labeled Time, in minutes, and the numbers 0 through 150, in increments of 30, are indicated. The vertical axis is labeled Relative Mass of Dialysis Bag. The axis has an arrowhead at the top end, and no numbers are indicated along it. The graphed line begins at 0 minutes, about halfway up the vertical axis, and extends horizontally to the right until it ends at 150 minutes. A label indicates Albumin Added at 30 minutes.

B.


The figure presents a graph in the coordinate plane. The horizontal axis is labeled Time, in minutes, and the numbers 0 through 150, in increments of 30, are indicated. The vertical axis is labeled Relative Mass of Dialysis Bag. The axis has an arrowhead at the top end, and no numbers are indicated along it. The graphed line begins at 0 minutes, about halfway up the vertical axis, and extends horizontally to the right until 30 minutes. A label indicates Albumin Added at 30 minutes. The graphed line starts to move downward and to the right at 30 minutes until it ends at 150 minutes, just above the horizontal axis.

C.


The figure presents a graph in the coordinate plane. The horizontal axis is labeled Time, in minutes, and the numbers 0 through 150, in increments of 30, are indicated. The vertical axis is labeled Relative Mass of Dialysis Bag. The axis has an arrowhead at the top end, and no numbers are indicated along it. The graphed line begins at 0 minutes, about one third of the way up the vertical axis, and moves upward and to the right until it is about halfway up the vertical axis at 30 minutes. A label indicates Albumin Added at 30 minutes. The graphed line then moves downward and to the right until it ends at 150 minutes, about one third of the way up the vertical axis.

D.


The figure presents a graph in the coordinate plane. The horizontal axis is labeled Time, in minutes, and the numbers 0 through 150, in increments of 30, are indicated. The vertical axis is labeled Relative Mass of Dialysis Bag. The axis has an arrowhead at the top end, and no numbers are indicated along it. The graphed line begins at 0 minutes, about halfway up the vertical axis, and extends horizontally to the right until 30 minutes. A label indicates Albumin Added at 30 minutes. The graphed line then moves upward and to the right until it ends at 150 minutes, near the top of the vertical axis.

Answer/Explanation

Answer: B.

Explanation:

What’s Going on in the Experiment?

  • We’ve got dialysis bags filled with distilled water placed in beakers of distilled water → so initially, it’s isotonic (no net water movement).
  • After 30 minutes, we add albumin (a medium-sized protein) to the beaker, not the bag.
  • Important thing: Albumin is too big to pass through the dialysis membrane, but water molecules can move freely.

What Happens Next?

Adding albumin outside the bag increases the solute concentration in the beaker, making the outside solution hypertonic relative to the inside of the bag.

  • So, by osmosis, water moves OUT of the dialysis bag (from lower to higher solute concentration).
  • This causes the mass of the bag to decrease over time.

Graph Analysis:

Let’s match this to the options:

  • Graph A: Flat line → No change in mass at all. Wrong.

  • Graph B: Perfect match

    • Flat first 30 mins = isotonic, no change.

    • Then gradual decline = water leaving the bag after albumin makes the outside hypertonic.

  • Graph C: Mass increases before albumin is added, then decreases. No reason for the increase early on.

  • Graph D: Mass increases after albumin is added. Opposite of what should happen.

Correct Answer: B

Why?
Because after adding albumin, the solution outside the dialysis bag becomes hypertonic, pulling water out of the bag → hence, mass decreases.

Question

If the ER (endoplasmic reticulum) is completely removed from a cell, the cell can function normally for a short time but is unable to synthesize new ER during this time. Which of the following is the most likely explanation for this phenomenon?
(A) The genes for ER synthesis are present in the ER.
(B) The ER is not an obligatory organelle in most cells.
(C) The genes for ER synthesis are irreversibly turned off once cell development is complete.
(D) The information required to construct the ER does not reside exclusively in the DNA.

Answer/Explanation

Answer: (D) The information required to construct the ER does not reside exclusively in the DNA.

Explanation:

The endoplasmic reticulum (ER) is an organelle made by the cell using instructions from DNA in the nucleus. However, the ER cannot form completely from scratch without existing ER membranes and proteins to help guide its assembly. This means the cell needs some ER material to build new ER.

Option Evaluation:
A. Incorrect – Genes for ER proteins are located in the nucleus, not in the ER itself.
B. Incorrect – The ER is essential for many cell functions, so it is not non-obligatory.
C. Incorrect – The genes for ER proteins remain active as needed; they are not permanently turned off after development.
D. Correct – Although DNA contains the instructions, the cell also needs existing ER structures to build new ER. Without any ER, the cell lacks the machinery to make new ER from DNA instructions alone.

Question

The diagram represents transcription and translation.

What structures do the letters X and Y represent?

▶️Answer/Explanation

Answer: D

Explanation:

First, understanding what X and Y are based on the image:

X is…

  • A single-stranded molecule coming out of the DNA (which is double-stranded on the right side).
  • It’s clearly not DNA (because DNA is double-stranded).
  • This strand is being read by tRNA during translation → that’s mRNA.

So, X = mRNA

Y is…

  • A three-base sequence on that mRNA.
  • The tRNAs are matching their own sequences (anticodons) to this sequence.
  • That means Y = the triplet on mRNA, which is called a codon.

So, Y = codon

Let’s now break down the options:

OptionXYCorrect?
ADNAanticodonX is not DNA, Y is not anticodon
BmRNAanticodonY is codon, not anticodon
CDNAcodonX is not DNA
DmRNAcodonThis is the correct match

Memory Trick:

  • Codon = on the mRNA (CO-ME… CODON-MRNA)
  • Anticodon = on tRNA, it’s the anti to the codon
Scroll to Top