▶️ Answer/Explanation
a.
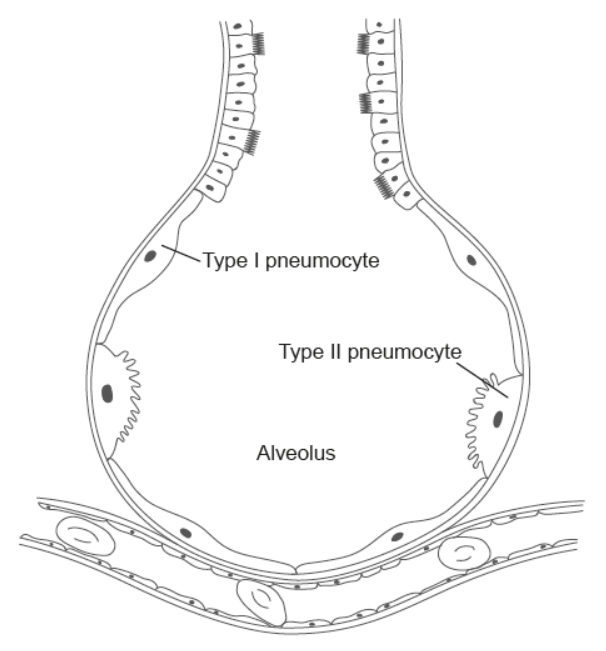
Type I pneumocytes:
- These are extremely thin cells forming the majority of the alveolar wall.
- Their main role is to allow gases like oxygen and carbon dioxide to pass easily between the air in the alveoli and the blood in the capillaries.
- Their thin structure minimizes the diffusion distance, making gas exchange efficient.
Type II pneumocytes:
- These are larger, cuboidal cells found less frequently in the alveolar wall.
- They produce and secrete surfactant, a fluid that coats the inside of the alveoli.
- Surfactant reduces surface tension, preventing the alveoli from collapsing during exhalation.
- They also help repair damaged alveolar tissue and replace Type I cells when needed.
b.
- Oxygen movement: The concentration of oxygen is higher in the alveoli than in the blood arriving at the capillaries. Oxygen dissolves in the thin layer of moisture lining the alveolus, then diffuses across the alveolar wall and capillary wall into the blood. Once in the blood, it binds to hemoglobin in red blood cells, keeping the oxygen concentration low in plasma and maintaining a steep gradient for continued diffusion.
- Carbon dioxide movement: Carbon dioxide is more concentrated in the blood (coming from the body’s tissues) than in the alveolar air. It diffuses out of the blood, through the capillary wall and alveolar wall, and into the alveoli to be exhaled.
- The thin barrier formed by the alveolar and capillary walls, combined with a large surface area and constant blood flow, ensures gas exchange is rapid and efficient.
Markscheme:
a. Pneumocyte Functions:
Type I:
• Carry out gas exchange \(\sqrt{ }\)
OR
• Facilitate diffusion of gases (\(\mathrm{CO}_2\)/\(\mathrm{O}_2\))
Type II:
• Secrete pulmonary surfactant \(\checkmark\)
• Maintain alveolar fluid balance
b. Gas Exchange Mechanism [3]:
1. Oxygen exchange:
• Higher \(\mathrm{O}_2\) concentration in alveoli than capillary blood \(\checkmark\)
• Hemoglobin maintains concentration gradient by binding oxygen \(\checkmark\)
• \(\mathrm{O}_2\) dissolves in alveolar fluid \(\checkmark\)
• Diffuses through alveolar-capillary membrane into blood \(\checkmark\)
2. Carbon dioxide exchange:
• Higher \(\mathrm{CO}_2\) concentration in blood than alveolar air \(\checkmark\)
• \(\mathrm{CO}_2\) diffuses from blood into alveoli \(\checkmark\)