▶️ Answer/Explanation
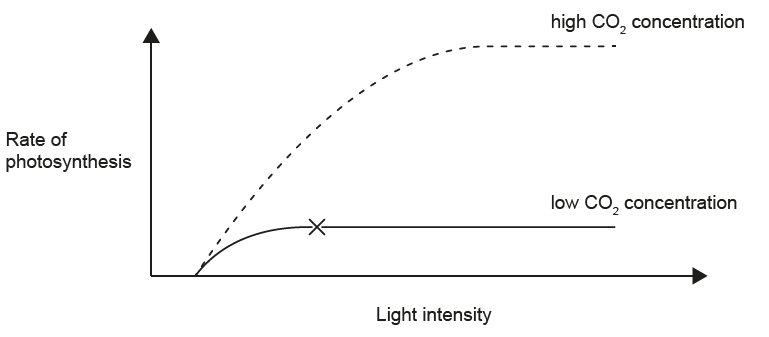
At low \( \mathrm{CO_2} \) concentration, the curve quickly reaches a plateau even as light intensity increases. A plateau means that raising light no longer increases the rate, so light is not limiting at \(x\). Temperature is fixed at \(25^{\circ}\mathrm{C}\) and chlorophyll content is not the changing variable here. Therefore, the factor restricting the rate at \(x\) is the availability of \( \mathrm{CO_2} \).
✅ Answer: (B)

▶️ Answer/Explanation
Answer: D. Chlorophyll a and chlorophyll b have different absorption peaks
Explanation:
The graph shows the absorption spectra of chlorophyll a and b across the wavelength range of 400–700 nm.
- Chlorophyll a (solid line) shows two main absorption peaks:
- One in the blue-violet region (~430 nm)
- Another in the red region (~660 nm)
- Chlorophyll b (dashed line) also has two peaks, but they differ slightly:
- One in the blue region (~455 nm)
- Another in the red-orange region (~640 nm)
Therefore, both pigments absorb light at different specific wavelengths, indicating different absorption peaks.
Option Evaluation:
A. Incorrect – Green light (around 500–600 nm) is mostly not absorbed by either pigment; this is why plants appear green (they reflect it).
B. Incorrect – Chlorophyll b absorbs blue light more efficiently than red light, as seen from its higher blue peak.
C. Incorrect – While other pigments (like carotenoids) do absorb light between blue and red, this cannot be concluded from this graph alone since it only shows chlorophyll a and b.
D. Correct – The graph clearly demonstrates that chlorophyll a and chlorophyll b absorb light at different wavelengths, confirming they have different absorption peaks.
▶️ Answer/Explanation
Answer: A. They do not have a source of energy.
Explanation: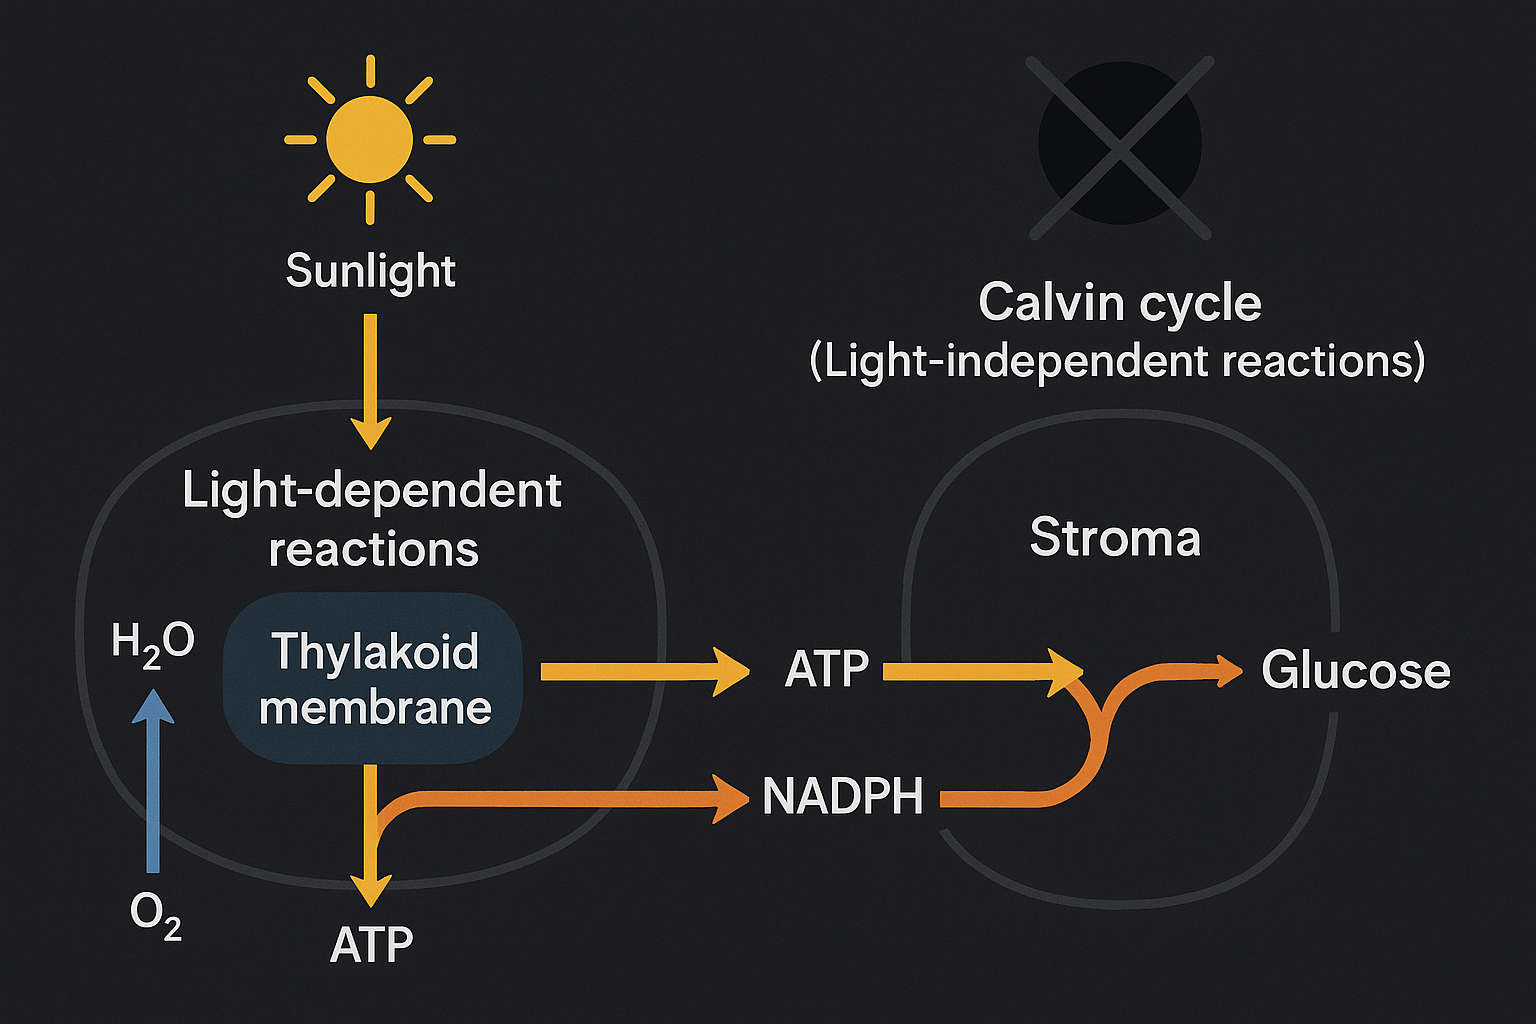
Plants convert carbon dioxide (\(CO_2\)) into glucose through the process of photosynthesis, which occurs in two stages:
- Light-dependent reactions – take place in the presence of light and produce ATP and NADPH, the energy carriers required for glucose production.
- Light-independent reactions (Calvin cycle) – use ATP and NADPH to convert \(CO_2\) into glucose.
At night or in the dark, light-dependent reactions cannot occur. This means no ATP or NADPH are produced, and without these energy sources, the plant cannot power the Calvin cycle. Therefore, CO₂ cannot be converted into glucose in the absence of light.
Option Evaluation:
A. Correct – In the dark, plants lack ATP and NADPH, so they do not have energy to drive glucose synthesis.
B. Incorrect – Temperature may influence reaction rates but is not the main reason glucose cannot be produced at night.
C. Incorrect – Plants still need glucose at night for cellular respiration; they simply cannot make it without light energy.
D. Incorrect – The enzymes of the Calvin cycle are not inhibited in the dark; they just lack the necessary energy molecules (ATP and NADPH) to function.