Home / IB DP Biology C4.1 Populations and communities-FA 2025- IB Style Questions For SL Paper 2

IB DP Biology C4.1 Populations and communities-FA 2025- IB Style Questions For SL Paper 2

Question

The feed conversion ratio (FCR) of grouper fish, Epinephelus coioides, was compared at two different fish densities in two types of tanks over a period of 10 weeks. The recirculation tank reused the same water, which was constantly purified. The flow-water tank had a continuous flow of clean water.

FCR comparison graph
(a) State the effect of increasing fish density on feed conversion ratios.
(b) Evaluate the rearing of grouper fish as food for humans at high density using recirculation tanks rather than water-flow tanks.
▶️ Answer/Explanation

(a)

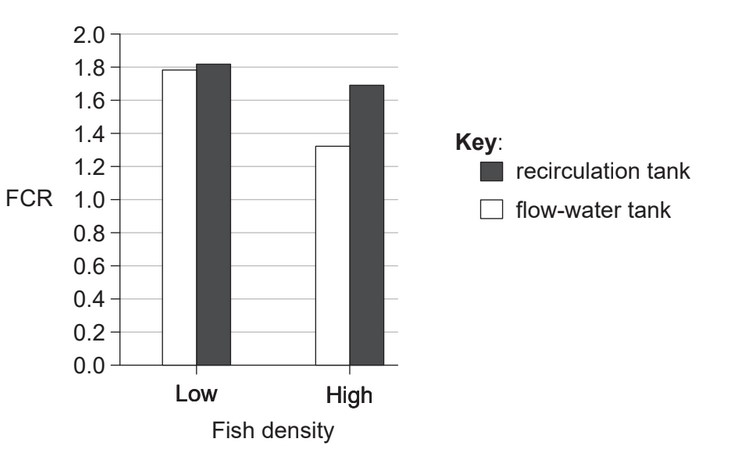
When the number of fish increases (higher density), the feed conversion ratio (FCR) goes down, meaning the fish are using food more efficiently.

(b)

Using recirculation tanks at high fish density has some good and bad points:

  • On the positive side, the water is reused after being cleaned, so it saves water and reduces pollution going into the environment.
  • But on the negative side, fish in recirculation tanks need more food to grow compared to those in flow-water tanks, which can make it more expensive to raise them.

Markscheme: 

(a) Feed conversion ratios (FCRs) decrease with increasing fish density.

(b) Evaluation of recirculation tanks vs water-flow tanks:

Advantages:

  • Less water is wasted (as it is purified and re-used)
  • Less impure water is released to the environment

Disadvantages:

  • Recirculation tanks have higher feed conversion ratio
  • More food/energy needs to be supplied to the fish
  • OR recirculation systems may cost more to maintain

Question

Scientists examined the distribution of lichen species in Seoul, South Korea. The line graph shows the number of lichen species found on the bark of trees in green areas at different distances from the city centre.

Lichen species distribution graph

(a) Describe the trend in the distribution of lichen species.
(b) Explain how lichens can be used as indicator species.
(c) Describe a method that can be used to measure the diversity of herbaceous plants in one of the green areas at different distances from the main road.
▶️ Answer/Explanation

(a)

As you move farther from the center of Seoul, the number of lichen species generally increases. This shows a positive trend.

(b)

Lichens are indicator species because they are sensitive to air pollution. If there are fewer or no lichens, it often means the air is polluted. More lichens suggest cleaner air.

(c)

To measure plant diversity near a road:

  1. Stretch a transect line from the road into the green area.
  2. Place quadrats at regular points along the line.
  3. In each quadrat, record the number and types of plant species.
  4. Use this data to calculate Simpson’s Diversity Index to compare areas.

Markscheme: 

(a) Trend in Lichen Distribution

Lichen species increase as distance from the city centre increases / positive correlation/trend;

(b) Lichens as Indicator Species

a. Indicator species live in specific environmental conditions;

b. Absence (of lichens) is an indicator of (air) pollution;

c. Relative numbers of indicator species could be used to calculate biotic index;

d. Biotic index can be used to monitor pollution levels over time;

e. Can help evaluate anti-pollution actions/measures;

(c) Measuring Plant Diversity

a. Lay a line/belt transect line away from the road;

b. Quadrat sampling can be used;

c. Record the number of different species;

d. Count the number of plants in each species;

e. Calculate diversity using the (reciprocal) Simpson’s diversity index;

Question

In 1997 in South Africa, a decision was made to decrease the use of mosquito-killing pesticides due to their negative effect on the environment. Mosquitoes are known to be responsible for the spread of malaria. In 2001 the decision was reversed and the use of pesticides was increased. The graph shows the estimated numbers of people with malaria in each year.

a. Outline the trend in the number of people with malaria during the period when the use of pesticides was decreased in South Africa. 

b. One pesticide used in killing mosquitoes was DDT. Considering its harmful effects, discuss whether the decision to reintroduce it was justified. 

▶️ Answer/Explanation

(a)

Between 1997 and 2000, when pesticide use was reduced, the number of malaria cases increased sharply, reaching a peak around the year 2000.

(b)

Reintroducing DDT helped reduce malaria cases, which protects human health and saves lives. However, DDT harms the environment by building up in food chains (biomagnification), which can affect animals like birds.
The decision may be justified in serious outbreaks but should be controlled and targeted, to limit environmental damage.

Markscheme: 

a.
The number of people with malaria increased.

b.

  • A choice had to be made between damage to environment or increase in malaria
  • DDT may lead to biomagnification/bioaccumulation in food chains
    OR
    Taken up by species in lower trophic levels becoming more concentrated at higher trophic levels
  • Causes harm to consumers at end of food chain
    OR
    Example (e.g., thin egg shells of falcons)
  • DDT is shown to be effective in reducing malaria
  • Possible partial solution to be selective in areas sprayed with DDT
  • May kill insects that are not pests

Question

Forest fires are very common in the Amazon forest. A study was performed to see the relationship between forest fragmentation, fire and management.

a. Describe one method that could have been used to estimate the population size of a given tree in a forest after fire damage had occurred. 

b. Outline how the edge effect can affect diversity in forests. 

c. The number of plants in two fields of approximately the same size was counted.

Compare and contrast the richness and the evenness of the two fields. 

▶️ Answer/Explanation

(a)

One way to estimate the tree population after a fire is by using quadrats. Researchers can place several quadrats randomly or in a grid across the affected area. They count the number of trees of the species in each quadrat, then calculate an average and multiply by the total area to estimate the full population.

(b)

The edge effect happens near the boundary of a forest and a different area (like farmland or roads). These edge zones often get more light, wind, or human impact. This can reduce the number of species that need deeper forest conditions, so overall diversity might decrease if the forest becomes too fragmented. However, edge species may increase in number.

(c)

  • Richness (number of species) is the same in both fields because each has three species.
  • Evenness is different: Field 1 has a more balanced number of daisies, dandelions, and buttercups, while Field 2 is mostly buttercups. So, Field 1 has higher evenness, meaning its diversity is more balanced.

Markscheme: 

a. Population estimation methods:
ALTERNATIVE 1
• Transect through a given area
• Trees counted on transect
• Calculation of total population considering area
ALTERNATIVE 2
• Random sampling using quadrats
• Trees counted in quadrat
• Population calculated using area
ALTERNATIVE 3
• GPS/Google Earth used to map individuals of a tree species
• Database of data obtained
• Population density calculated using area

b. Edge effect on diversity:
• Edge effects are the changes in community structures that occur at the boundary of two habitats
• Areas with small habitat fragments exhibit especially pronounced edge effects
• Edge species will always have a habitat
OR
• Edge biodiversity increases
• If patches of forest are too small the non-edge species cannot find a habitat
• Then overall non-edge biodiversity is lower

c. Field comparison:
• Same richness as they have the same number of species/total of individuals
• Field 1 has more evenness as more even distribution of numbers among the species
Accept correct use of Simpson diversity index.

Scroll to Top