Home / IB DP Biology- C4.2 Transfers of energy and matter- IB Style Questions For HL Paper 2

IB DP Biology- C4.2 Transfers of energy and matter- IB Style Questions For HL Paper 2 -FA 2025

Question

Freshwater mussels are molluscs that inhabit rivers and lakes in many regions worldwide. They filter water to obtain food and in the process remove algae, bacteria and detritus, thereby helping to improve water quality.

Researchers in South Korea placed mussels (U. douglasiae) into water containing cyanobacteria, a group of photosynthetic bacteria responsible for eutrophication in aquatic environments. The density of cyanobacteria is directly related to the concentration of chlorophyll in the water. The filtration efficiency of mussels can be assessed by observing how chlorophyll concentration changes over different time intervals. The experiments were performed at two different dissolved oxygen levels (DO). In the control experiment, no mussels were introduced and the DO level was \( 9.0 \text{ mg L}^{-1} \).

(a) Estimate the chlorophyll concentration of the control at \( 18 \) hours.
(b) Describe the difference in cyanobacteria density between the control (no mussels) and the treatment with mussels at \( DO = 9.0 \text{ mg L}^{-1} \).
(c) Propose a reason for the change in chlorophyll concentration in the control over the course of the experiment.
(d) Compare and contrast the filtration patterns of mussels at the two dissolved oxygen levels throughout the investigation.

In \( 2020 \), scientists investigated the population density of four mussel species (A. anatina, U. pictorum, U. tumidus, and P. complanata) in the River Thames (United Kingdom). They compared their findings with results collected at the same site in \( 1964 \). The chart illustrates the percentage of each live species found in both years, as well as the percentage of empty shells discovered in \( 2020 \).

(e) Estimate the percentage of U. pictorum recorded as live mussels in \( 1964 \).
(f) Indicate, with a reason, whether the mussel shells found in \( 2020 \) more closely match the live species distribution of \( 1964 \) or \( 2020 \).
(g) Evaluate whether the data supports the idea that the population of U. tumidus has increased since \( 1964 \).

The researchers also examined how mussel density varied at different water depths. The graph below shows the data for U. pictorum and U. tumidus.

(h) Calculate the mean percentage decrease in density of U. pictorum in \( 1964 \) when depth increased from \( 1–2 \text{ m} \) to \( 2–3 \text{ m} \).
(i) Compare and contrast the changes in mean density of both species between \( 1964 \) and \( 2020 \).
(j) Using all the data provided, deduce whether the water quality of the River Thames changed between \( 1964 \) and \( 2020 \), giving reasons for your conclusion.

Most-appropriate topic codes (CED):

TOPIC C4.2: Transfers of energy and matter — parts (b), (c)
TOPIC D4.2: Stability and change — part (j)
TOPIC C4.1: Populations and communities — parts (f), (g)
▶️ Answer/Explanation
Detailed solution

(a)
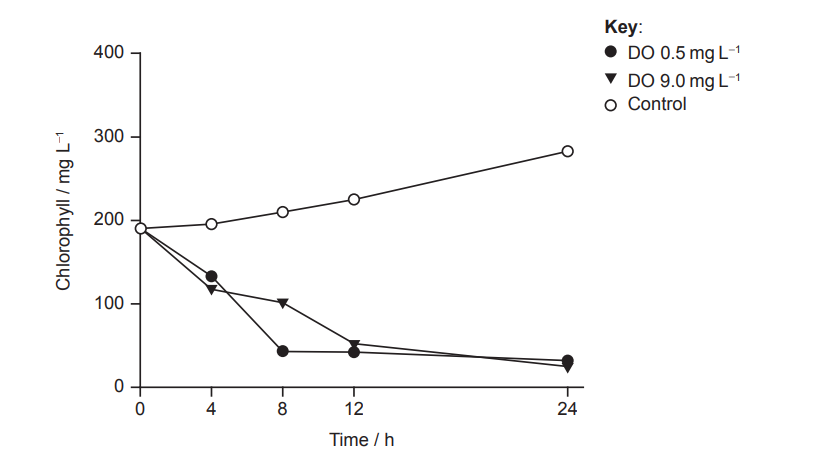
Estimated chlorophyll concentration: \( 250 \text{ mg L}^{-1} \) (Acceptable range: \( 240–260 \text{ mg L}^{-1} \)).

(b)
• In the control (no mussels), chlorophyll levels — and therefore cyanobacteria density — increase steadily.
• In the presence of mussels at \( DO = 9.0 \text{ mg L}^{-1} \), chlorophyll concentration decreases due to filtration.

(c)
Cyanobacteria are photosynthetic and would reproduce and grow during the experiment, increasing chlorophyll concentration.

(d)
Similarity: At both DO levels, mussels reduce chlorophyll concentration.
Difference: Filtration is initially faster at \( DO = 0.5 \text{ mg L}^{-1} \) but stops after around \( 12 \) hours, whereas filtration continues slowly at \( DO = 9.0 \text{ mg L}^{-1} \).

(e)
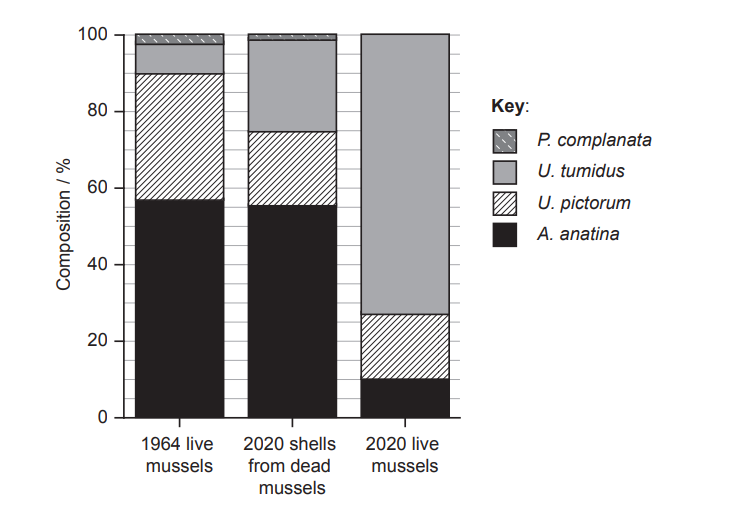
Estimated percentage of U. pictorum in \( 1964 \): \( 33\% \) (Based on graph: approximately \( 90\% – 57\% = 33\% \)).

(f)
The shell composition from \( 2020 \) most closely matches the 1964 live species distribution. Reason: The shells have high proportions of A. anatina and U. pictorum, similar to the \( 1964 \) pattern.

(g)
The data does not confirm an increase in the actual population of U. tumidus. Although its percentage increased (from about \( 8\% \) in \( 1964 \) to about \( 74\% \) in \( 2020 \)), the total mussel population may have declined. Thus, the absolute number may be lower.

(h)
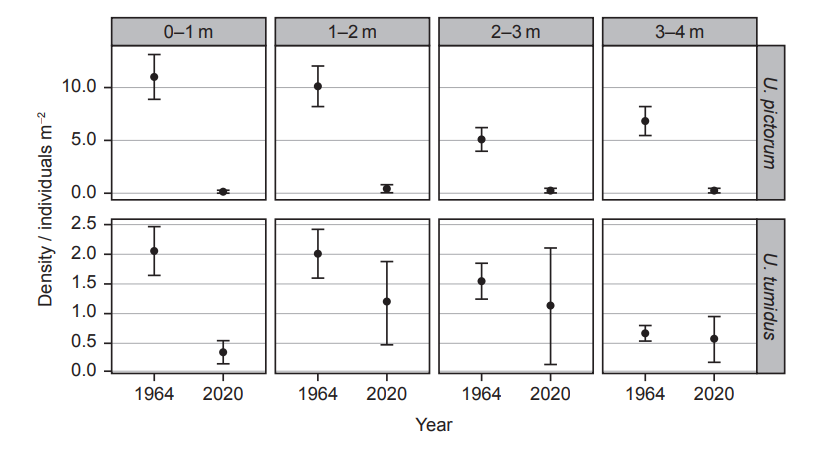
Density at \(1–2 \text{ m}\): \( \approx 10.0 \text{ individuals m}^{-2} \)
Density at \(2–3 \text{ m}\): \( \approx 5.0 \text{ individuals m}^{-2} \)
Percentage decrease: \[ \frac{(10.0 – 5.0)}{10.0} \times 100 = 50\% \]

(i)
Similarity: Both species show a decline in density from \( 1964 \) to \( 2020 \).
Difference: U. pictorum declines sharply at all depths, approaching zero in \( 2020 \), while U. tumidus only shows a major drop at the shallowest depth.

(j)
The data suggests water quality may have deteriorated. Mussels filter and improve water, and a sharp reduction in mussel density — especially U. pictorum — indicates they may not be surviving due to poorer environmental conditions. Alternatively, a shift in species composition (dominance of U. tumidus) implies changes in water quality that favor certain species over others.

Scroll to Top