Question
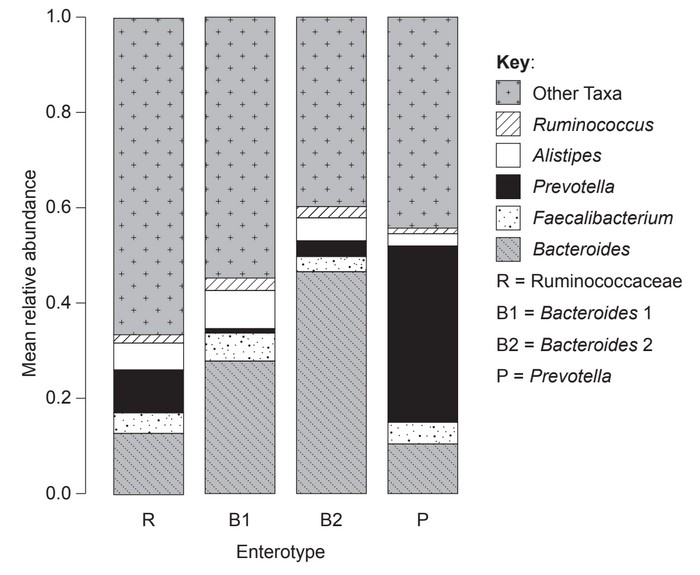
There is increasing interest in the bacteria that live in the human gut, known as the gut microbiota. Evidence is accumulating of widespread effects on human health, with some species of bacteria increasing the prevalence of specific diseases and others giving protection. Long-term diet appears to influence the numbers and types of bacteria that are present in an individual’s gut. Several different characteristic combinations of bacteria (called enterotypes) have been discovered. The stacked column graph shows relative amounts of different genera of bacteria in the gut of people with four of these enterotypes. The Bacteroides 2 (B2) enterotype is associated with an increased prevalence of inflammatory bowel disease.

(a) Using the data in the stacked column graph, describe the features that characterize the B2 enterotype.
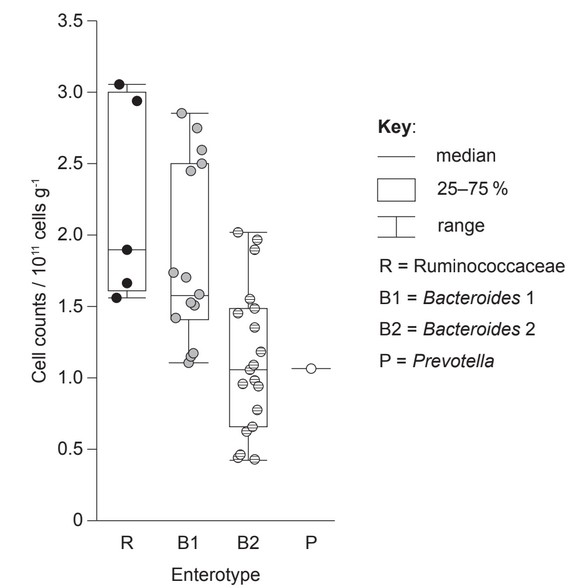
Samples of feces were collected from 40 individuals and were immediately frozen to preserve them. The numbers of bacteria in the feces (cell counts / 1011 cells g-1) were later measured and the enterotype was determined. The box plot shows this data. Each data point shows the cell count from one fecal sample.

(b) Estimate the median number of bacterial cells per gram of feces in the R enterotype.
(c) Distinguish between the cell counts in the R and B2 enterotypes.
(d) Comment on the data for the P enterotype.
Statins are drugs that are commonly prescribed to reduce cholesterol concentrations in the blood. As part of research into the effects of statins, the enterotype and body mass index (BMI) of 782 individuals were determined. The results are shown in the stacked graph.
(e) (i) Estimate the prevalence of the P enterotype at a BMI of 50.
(ii) State the relationship between BMI and the prevalence of the B2 enterotype.
(f) Evaluate the evidence provided by the data in the graph for the hypothesis that the R enterotype causes low BMI.
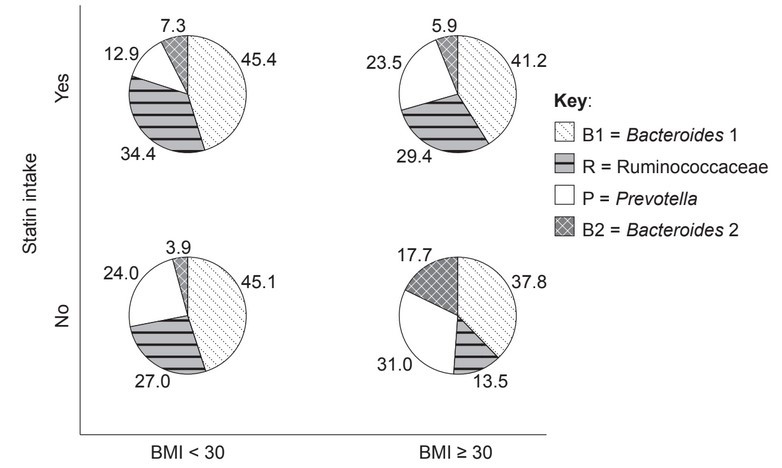
The 782 individuals for whom BMI and enterotype had been determined were divided into four groups, according to whether or not they were taking statins and their BMI category. The prevalence of the four enterotypes in each of these groups is shown as a percentage in the pie charts.

(g) The prevalence of inflammatory bowel disease rises with increases in BMI. At any BMI level, individuals with the B2 enterotype have a higher prevalence of inflammatory bowel disease than with other enterotypes. Using the data in the graph, discuss whether statins could reduce the incidence of inflammatory bowel disease.
Answer/Explanation
Answer:
(a)
a. nearly half is Bacteroides / more Bacteroides (than other enterotypes);
b. few Prevotella/fewer Prevotella than in P and R
OR
less Faecalibacterium than other enterotypes
OR
Ruminococcus is the lowest in B2;
c. only 40% other taxa / fewer other taxa (than other enterotypes) / less overall
diversity (of taxa);
(b) 1.9 x \(10^{11}\) / 190000 million / 190 billion (cells per gram);
(c)
a. lower values for cell counts in B2 (than in R) / converse
OR
median is higher in R (than in B2) / R median is 1.9 versus B2 median is 1.1
OR
lower number of cell counts in R;
b. all counts in R higher than third/75th/upper quartile in B2
OR
25-75% range (box) in B2 is smaller than in R;
c. R maximum 3.1 versus B2 maximum is 2.1
OR
R maximum is higher than B2 max;
d. B2 minimum is lower than R minimum;
(d)
a. only one sample/count/data point;
b. only analysed feces from one person (with this enterotype);
c. not a big enough sample;
(e)
(i) 0.35;
(ii) B2 is associated/commoner/more prevalent in people with higher BMI
OR
(prevalence of) B2 increases as BMI increases;
(f)
a. R is more common/prevalent in people with low BMI;
b. statement about it being far more common;
c. but this correlation does not prove that R causes low BMI;
d. low BMI could(actually) be the cause of higher prevalence of R;
(g)
a. high/highest % of B2 enterotype in people with BMI greater than (or equal to)
30 with no statins
OR
taking statins could reduce the percentage of B2 enterotype in people with BMI
≥ 30
OR
reducing BMI to below 30 could lower % of people with B2 enterotype without
taking statins;
b. but statins may not cause a person to change from B2 to another enterotype
OR
lower B2 in those taking statins if BMI is >30 so might reduce IBD/inflammatory
bowel disease
OR
but when BMI < 30, there is almost double the prevalence of B2 in those taking
statins so might not have an effect / increase (prevalence of) inflammatory
bowel disease;
Question
Smartphone data from more than 700 000 individuals in 111 countries was used to estimate their activity levels. Data from more than 68 million days of activity was analysed, including the numbers of steps taken per day. The graph shows the distribution of numbers of steps per day for four countries.

(a) State the mode for the number of steps per day in Japan and USA, rounding your answers up or down to the nearest 1000 steps.
Japan: . . . . . . . . . . . . . . . . . . . . . . . . . . . . . . . . . . . . . . . . . . . . . . . . . . . . . . . . . . . . . . . . . . . .
USA: . . . . . . . . . . . . . . . . . . . . . . . . . . . . . . . . . . . . . . . . . . . . . . . . . . . . . . . . . . . . . . . . . . . .
(b) Distinguish between the distribution of activity in Saudi Arabia and the UK.
Walkability is a measure of how friendly an urban area is for walking. The researchers determined a walkability score for cities in the USA, based on such measures as block length, availability of sidewalks and distances between homes and destinations such as shops, workplaces or parks. They also calculated a coefficient of activity inequality for each city from the variation among individuals in number of steps per day. A coefficient of zero would indicate that all individuals took the same number of steps. The scattergraph shows the relationship between walkability and activity inequality for the 69 cities where smartphone data was available for at least 200 individuals.

(c) Identify the city with the highest and the city with the lowest walkability.
Highest: . . . . . . . . . . . . . . . . . . . . . . . . . . . . . . . . . . . . . . . . . . . . . . . . . . . . . . . . . . . . . . . . . .
Lowest: . . . . . . . . . . . . . . . . . . . . . . . . . . . . . . . . . . . . . . . . . . . . . . . . . . . . . . . . . . . . . . . . . .
(d) Suggest reasons for the relationship shown in the graph.
Combining the data for all countries, including the body mass index (BMI) of each individual, the researchers grouped males and females according to their mean number of steps per day. Using the BMI of each individual, they calculated the percentage of males and females who were obese (BMI over 30) for each of these groups. The chart shows the data.

(e) Compare and contrast the data in the chart for males and females.
(f) Suggest two hypotheses to account for the relationship between the mean number of steps per day and the proportion of people who are obese.
Hypothesis 1: . . . . . . . . . . . . . . . . . . . . . . . . . . . . . . . . . . . . . . . . . . . . . . . . . . . . . . . . . . . . .
. . . . . . . . . . . . . . . . . . . . . . . . . . . . . . . . . . . . . . . . . . . . . . . . . . . . . . . . . . . . .
Hypothesis 2: . . . . . . . . . . . . . . . . . . . . . . . . . . . . . . . . . . . . . . . . . . . . . . . . . . . . . . . . . . . . .
. . . . . . . . . . . . . . . . . . . . . . . . . . . . . . . . . . . . . . . . . . . . . . . . . . . . . . . . . . . . .
The scattergraph shows the coefficient of activity inequality and the percentage of the population that is obese in the 46 countries or regions for which data was available.

(g) State the relationship between activity inequality and obesity shown in the scattergraph.
(h) Using only evidence from the data in Question 1, suggest two strategies for reducing obesity in countries where this health problem is most prevalent.
Answer/Explanation
Answer:
(a) Japan: 6000 and USA: 4000; (both needed)
(b)
a. higher mode for the number of steps in UK/4000 versus 3000 in Saudi
Arabia;
b. UK has more variation/is more spread out/greater standard deviation
OR
UK has a more normal distribution;
c. people in UK take more steps than people in Saudi Arabia;
(c) highest: New York and lowest: Charlotte; (both needed)
(d)
a. majority of individuals are active/walk to places if walkability is high;
OR
high walkability encourages the habit of walking so the coefficient of
activity inequality would be low;
b. with low walkability some individuals take exercise/go jogging and some do not;
c. (with high walkability) people don’t need to drive increasing the incentive to
walk;
(e) Similarities (Compare)
a. lower percentage of obesity with more steps per day in both males and
females
OR
percentage obesity is most similar at 1000 steps
OR
correlation of steps to percent obesity plateaus after 8000 steps for both males
and females;
Differences (Contrast)
b. the range difference of obesity percentage among different steps is bigger in
females (9% – 31% versus 18% to 30%)
OR
walking has a greater impact on lowering obesity rates in females than males
OR
men show a greater percentage of obesity
OR
at 1000 steps per day there are more obese women than men;
(f) (any order)
a. obesity causes people to be less active/take fewer steps;
b. people who are less active/take fewer steps (are more likely to) become obese;
c. People who are not obese tend to have healthier habits, including walking more;
(g)
as activity inequality rises percentage obesity rises
OR
Positive/direct correlation/relationship;
(h)
a. use public education to encourage people to walk more/become more active;
b. improve city design to improve walkability;
c. reduce distances between homes / shops / workplaces / parks;
d. more sidewalks / make it easier for pedestrians to cross roads / other specific
measure;
Question
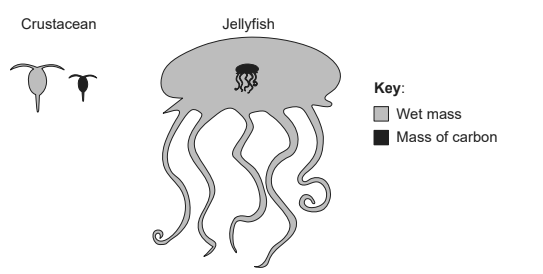
The mass of an individual organism can affect its physiology and feeding ecology. The diagram shows the relative mass of carbon (black) and total wet mass (grey) of a marine crustacean, Calanus hyperboreus and a jellyfish, Bathocyroe fosteri.

(a) State one process that results in the loss of carbon dioxide from a marine organism such as a crustacean or a jellyfish. [1]
(b) The crustacean and the jellyfish obtain carbon compounds by feeding. State one source of carbon for marine organisms, other than feeding. [1]
(c) Explain how energy enters, flows through and is lost from marine food chains. [3]
(d) (i) Deduce whether jellyfish or crustacea are a richer source of carbon in a food chain. [1]
(ii) Suggest with a reason whether having a large body mass is an advantage or disadvantage for jellyfish. [1]
▶️Answer/Explanation
Ans:
a
a. (aerobic/cellular) respiration
b. gas exchange / diffusion Do not accept photosynthesis. Do not accept breathing Organism is taken to be a living thing.
b
a. photosynthesis
b. absorption of (dissolved) carbon dioxide / (hydrogen)carbonate directly from the oceans Accept reference to carbonate or hydrogencarbonate ions
c
a. light energy is converted to chemical energy (in carbon compounds/sugars) by photosynthesis
b. (chemical) energy (in carbon compounds) flows by means of feeding/through food chains/webs
c. only (approximately) 10% of energy is passed to the next trophic level
d. energy released as heat (by respiration)
e. energy is not recycled f. after death, energy may remain trapped as undigested detritus/fossils/fossil fuels
d i crustacean as they have more carbon per unit volume OR crustacean as jellyfish has little carbon per total body size OWTTE The conclusion must be supported from the information
given
d ii
a. advantage of large size is ability to eat /catch large prey
b. (advantage as) lower rates of predation of large jellyfish
c. (advantage as) can produce more reproductive cells
d. (disadvantage as) can move slower to escape from predators/capture prey
e. (disadvantage as) needs more energy/nutrients to maintain structure/move/grow
f. (disadvantage as) low surface area to volume ratio and thus possibly difficulty with materials/gas/nutrient exchange g. (disadvantage as) more prone to mechanical damage during storms Accept other reasonable answer. Must say advantage or disadvantage
