Question
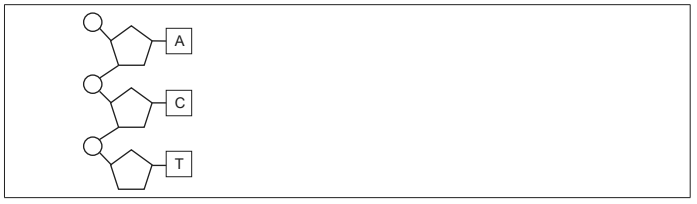
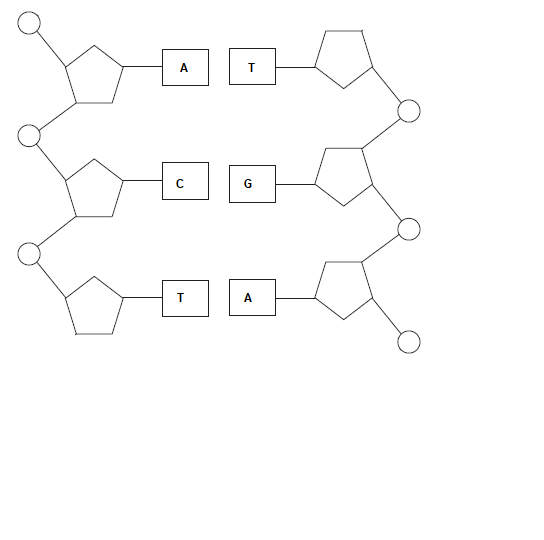
Sketch the complementary strand to complete the section of a DNA diagram.
 [3]
[3]
▶️Answer/Explanation
Ans
a.correct base sequence: T, G, A;
b.strand drawn anti-parallel;
c.correct shapes used;
Question
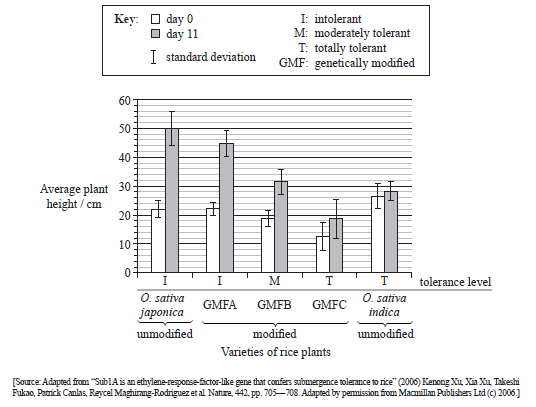
Rice (Oryza sativa) is usually intolerant to sustained submergence under water, although it grows rapidly in height for a few days before dying. This is true for one variety, Oryza sativa japonica. The variety Oryza sativa indica is much more tolerant to submergence.
Three genetically modified forms of O. sativa japonica, GMFA, GMFB and GMFC, were made using different fragments of DNA taken from O. sativa indica.
The plants were then submerged for a period of 11 days. The heights of all the plants were measured at the beginning and at the end of the submergence period.
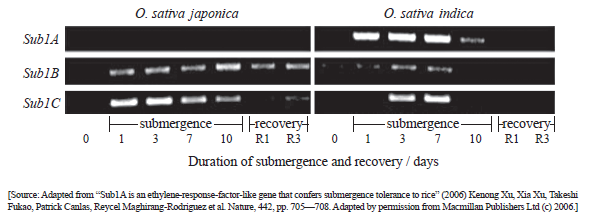
In the same experiment, the researchers hypothesized that the capacity to survive when submerged is related to the presence of three genes very close to each other on rice chromosome number 9; these genes were named Sub1A, Sub1B and Sub1C. The photograph below of part of a gel shows relative amounts of messenger RNA produced from these three genes by the submergence-intolerant variety, O. sativa japonica, and by the submergence-tolerant variety, O. sativa indica, at different times of a submergence period, followed by a recovery period out of water.
State which group of rice plants were the shortest at the beginning of the experiment.[1]
Calculate the percentage change in height for the O. sativa japonica unmodified variety during the submergence period. Show your working.[2]
Deduce the general relationship between the growth of all the japonica varieties and their stated tolerance level.[1]
Outline the use of the binomial system of nomenclature in Oryza sativa.[2]
Determine which gene produced the most mRNA on the first day of the submergence period for variety O. sativa japonica.[1]
Outline the difference in mRNA production for the three genes during the submergence period for variety O. sativa indica.[2]
Compare the mRNA production for the three genes during the submergence period between the two varieties.[2]
Deduce, using all the data, which gene was used to modify GMFC.[2]
Evaluate, using all the data, how modified varieties of rice could be used to overcome food shortages in some countries.[2]
▶️Answer/Explanation
markscheme
a(i).(GMF) C
a(ii).$\begin{aligned} & \frac{(50-22)}{22} \times 100 ; \\ & =127 \% ; \text { (umits required) (allow answers in the range of } 127 \text { to } 127.3 \text { ) }\end{aligned}$
inversely proportional / the higher the tolerance, the less the growth / vice-versa
a. first name/Oryza for genus / second name/sativa for species;
b. (all) members of Oryza satica share special/unique features;
c. two names make a unique combination to designate species / worldwide recognizable nomenclature;
d. varieties (japonica and indica) have some (consistent) differences (in tolerance);
Sub1C
e(i).
a. Sub1A is expressed strongly/the most / Sub1A produces the most RNA;
b. Sub1B (always) has the lowest expression/produces least mRNA;
c. Sub1A expressed/produces mRNA for the longest time/days 1 to 10;
d. Sub1C expressed/produces mRNA for the shortest time/days 3 to 7;
e(ii).
a. Sub1A only expressed/produces mRNA in indica / not/never expressed/ never produces mRNA in japonica;
b. Sub1C expressed/produces mRNA from day 1 in japonica, but not indica;
c. Sub1B has lower expression/production of mRNA than Sub1C in both varieties;
Award [1 max] for other accurate comparisons between japonica and indica.
e(iii).
a. Sub1A;
b. is only expressed in indica;
c. indica is the variety showing submersion tolerance;
f.
a. genetically modified rice/rice with Sub1A is more tolerant to submersion;
b. can withstand seasonal flooding/torrential rain;
c. GMF/tolerant rice ensures greater harvest/provides more food during flooding;
Question
Native oyster populations are decreasing where rivers meet the ocean along the northwest coast of North America. These oyster populations are being attacked by a gastropod.
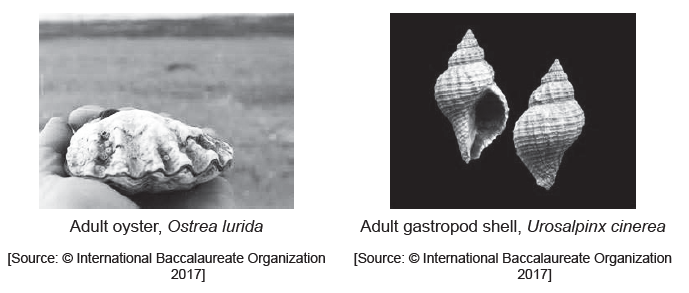
It is known that oysters and gastropods have hard parts composed of calcium carbonate and that ocean acidification is increasing. Studies were carried out using juvenile oysters and gastropods to investigate the effects of acidification on the decrease in the population of oysters.
The first step was to raise oysters in two different mesocosms. One had seawater at a normal concentration of $CO_{2}$ and the other had sea water with a high concentration of $CO_{2}$. Gastropods were raised in two further mesocosms with normal and high $CO_{2}$ concentrations respectively.
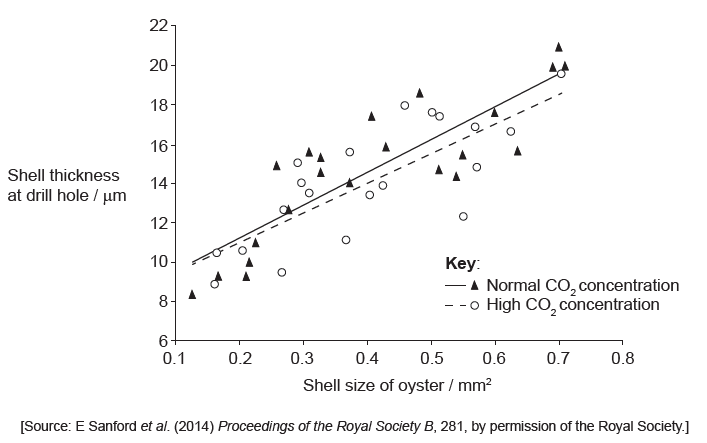
A juvenile gastropod will attack a juvenile oyster by using its tongue-like structure (radula) to drill a hole through the oyster shell. Once the hole has been drilled, the gastropod sucks out the soft flesh. Researchers investigated the shell thickness at the site of the drill hole in relation to the size of the oyster. The results are seen in this graph.
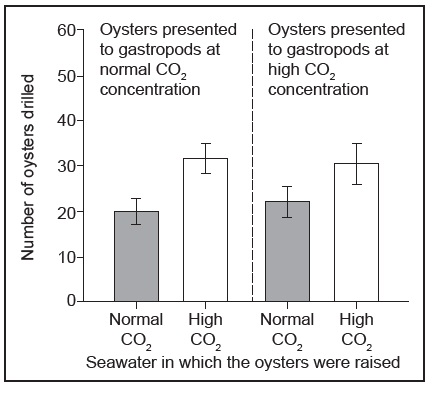
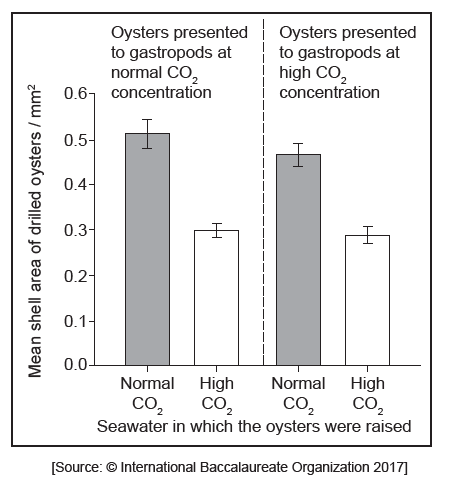
Equal numbers of oysters raised in seawater with a normal $CO_{2}$concentration and in seawater with a high $CO_{2}$ concentration were then presented together to the gastropod predators in seawater with a normal $CO_{2}$ concentration. The same numbers of oysters from the two groups were also presented together to the gastropods in seawater with a high $CO_{2}$ concentration. The bar charts show how many of the oysters were drilled by the gastropods and the mean size of drilled oysters.
Outline how acidified sea water could affect the shells of the oyster.[1]
Outline the trends shown in the data in the graph.[2]
Estimate how much smaller drilled oysters raised in seawater at a high $CO_{2}$ concentration were than drilled oysters raised in seawater at a normal $CO_{2}$ concentration.[1]
Deduce from the data in the bar charts which factors were and were not correlated significantly with the number of oysters drilled by the gastropods.[2]
Suggest reasons for the differences in the numbers of oysters drilled, as shown in the bar charts.[2]
The radula in a gastropod is hard but not made of calcium carbonate. Outline how this statement is supported by the drilling success of the gastropods in seawater with normal or high $CO_{2}$ concentrations.[2]
e. Using all the data, evaluate how $CO_{2}$ concentrations affect the development of oysters and their predation by gastropods.[2]
▶️Answer/Explanation
Markscheme
Shells might dissolve/deteriorate / become smaller/thinner/weaker / OWTTE
OR
shell formation reduced / more difficult
a. positive correlation between shell thickness and shell size
OR
as shell thickness increases, shell size «also» increases
b. (positive correlation) occurs at two different $CO_{2}$ concentrations / both high and normal concentrations
c. trend for thickness is «slightly» lower with high $CO_{2}$
«approximately» 0.2 mm2
OR
«approximately» 40 % «smaller»
unit required
a. significant factor: concentration of $CO_{2}$ in which oysters were raised
b. insignificant factor: concentration of $CO_{2}$ at which oysters were presented to gastropods
a. (because) shells are thinner/smaller when the oyster is raised in high $CO_{2}$/lower pH
OR
«because» lower pH/higher acidity prevents/reduces deposition of calcium carbonate
b. gastropods target smaller/thinner-shelled oysters more
c. gastropods can eat/drill thin-shelled/smaller oysters at a faster rate (and move onto another)
d. eating smaller oysters «from high $CO_{2}$ environments» means given population of gastropods require more oysters for same food intake
a. data shows that similar numbers are drilled regardless of conditions
b. since radulas are not affected by acidification
OR
radulas not made of calcium carbonate so (remain) strong/successful at drilling
a. the data/trend lines indicate that a higher $CO_{2}$ concentration diminishes the shell thickness, making gastropod predation more successful
OR
the bar graphs suggest that oysters raised in a higher $CO_{2}$ concentration are smaller, making gastropod predation more successful
b. $CO_{2}$ concentrations «during feeding» do not change the occurrence of drilling/predation «by gastropods»
c. «limitation» no information about how exaggerated the $CO_{2}$ concentrations were
OR
e.«limitation» no information about numbers of gastropods used «in each setting»
Question
The electron micrographs show mitosis in a cell at an early stage and an intermediate stage.
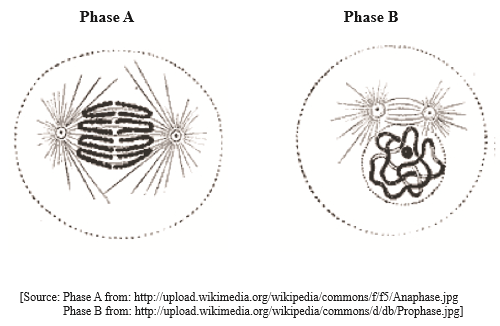
State the name of each phase shown, recording whether each phase has taken place at an early or intermediate stage of mitosis.
Phase A: . . . . . . . . . . . . . . . . . . . . .occurs at an. . . . . . . . . . . . . . . . . . . . . stage
Phase B: . . . . . . . . . . . . . . . . . . . . .occurs at an. . . . . . . . . . . . . . . . . . . . . stage[2]
a (i). Outline the events occurring in phase A.[2]
b. State what results when there is an uncontrolled division of cells in living organisms.[1]
c. DNA in chromosomes undergoes replication before mitosis. Outline how complementary base pairing is important in this process.[2]
▶️Answer/Explanation
Markscheme
a (i).
phase A: anaphase (occurs at an) intermediate (stage); (both needed)
phase B: prophase (occurs at an) early (stage); (both needed)
a (ii).
centromeres split/break;
(sister) chromatids/chromosomes separate;
dragged/pulled/movement to separate poles;
by shortening of spindle microtubules;
Do not allow events other than those in anaphase
b.
tumours / cancer
c.
conservation of the base sequence of DNA;
adenine pairs with thymine and cytosine pairs with guanine; (do not accept initials only)
both (daughter) cells/DNA strands produced have identical genetic information;
Question
Thrombophilia is a human genetic condition where the blood has an increased tendency to clot. The condition is caused by a single base substitution mutation in DNA. If a person is homozygous for the gene, they are at greater risk for developing a blood clot than an individual who is heterozygous. The pedigree chart shows the inheritance of thrombophilia in a family.
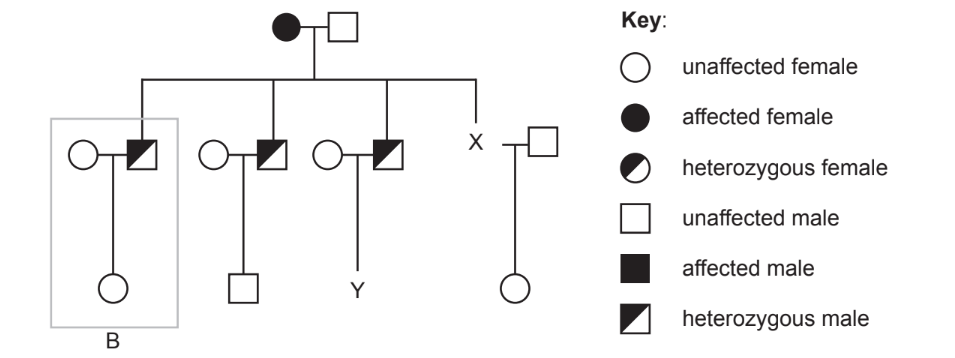
(a) Draw the symbol for individual X on the diagram. [1]
(b) Calculate the probability of male Y having an allele for the disorder. [1]
(c) Explain how the information in the box labelled B indicates that the gene is not sex-linked. [2]
(d) Explain how a single base substitution mutation in DNA can cause a change to a protein. [2]
▶️Answer/Explanation
a
![]()
b 50%/ 0.5/ 1/2;
c a. if it was sex-linked it would be on the x chromosome;
b. there cannot be a heterozygous male if the trait is sex-linked
c. males would pass the allele to their daughter;
d. daughter is not shown as heterozygous so it is not sex linked;
d a. sequence of DNA bases determines the amino acid sequence of a protein;
b. changing one base (on the DNA) can cause the triplet /mRNA to code for a different amino acid;
c. changing one base (on the DNA) causes a different protein to be made (during translation);