Question
Beavers are large rodents that live in waterways throughout the northern hemisphere. Dams made by beavers change the temperature of the streams and affect the mayfly, Baetis bicaudatus. In the summer of 2008, beaver ponds in West Brush Creek and Cement Creek, Colorado, were studied to evaluate their impacts on mayflies. The study sites included streams flowing into (upstream) and out of (downstream) each beaver pond.

Mayflies, including the species B. bicaudatus, are aquatic insects that hatch and spend their larval stages in water emerging from the water as adults. Larger females produce an increased number of better quality eggs.
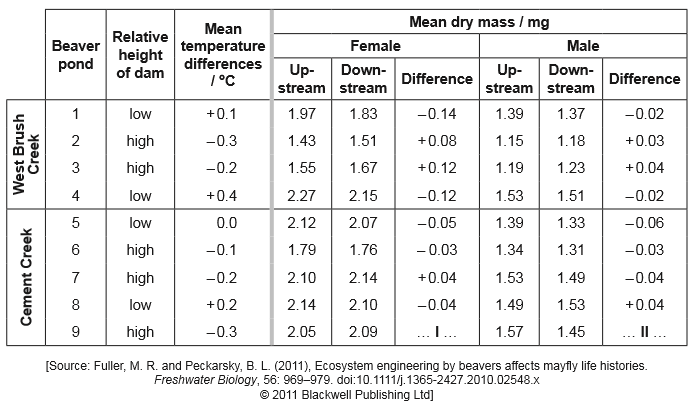
The table shows the mean temperature differences (downstream – upstream) and mean dry mass for female and male mayflies.
The bat, Pipistrellus nathusii, feeds on insects including mayflies. A study was undertaken in Poland to see the effect of European beavers (Castor fiber) on the activity of bats. Beaver activity can affect forests that are covered by trees and meadows that are covered by grasses and have no trees. The following habitats were studied:
- forest (F)
- flooded forest with canopy gaps created by beavers and flooding due to the presence of beaver dams (FFG)
- forest with canopy gaps created by beavers but no flooding (FG)
- meadow (M)
- meadow with flooding due to the presence of beaver dams (MF).
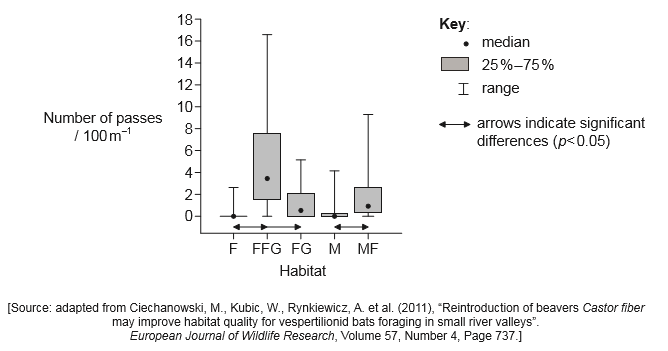
As bats feed they fly through the air catching insects. The number of feeding passes made by bats was counted. The graph shows differences in the bat activity between particular habitats.
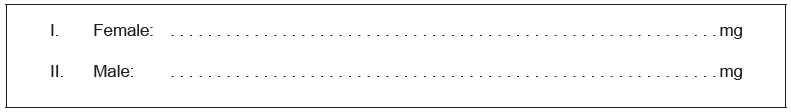
Calculate the difference in the mean dry mass of mayflies upstream and downstream of Cement Creek pond 9 for female and male mayflies.
Describe the effect dams have on water temperature.
The graph shows the mean dry mass of mayflies relative to the water temperature in their habitats.
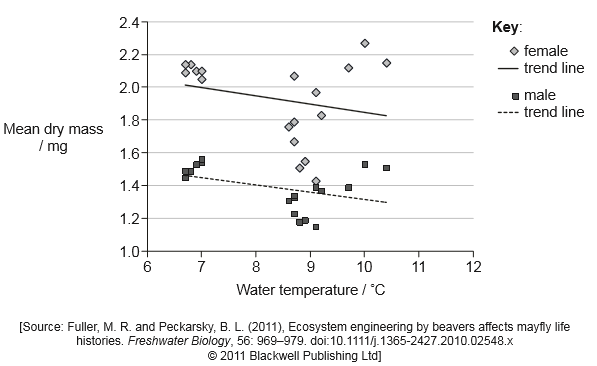
Using the graph, discuss evidence for the hypothesis that mayflies grow to greater dry mass in cooler water.
Analyse the data to find the effect of flooding and tree felling by beavers on the activity of bats.
The trout, Oncorhynchus mykiss, that live in West Brush Creek and Cement Creek also feed on the mayflies. Fishermen come to Colorado to catch and eat trout. Draw a diagram of part of a food web for the creeks in Colorado, including mayflies, humans, trout and bats.
Identify an example of competition between organisms in this food web.
The North American beaver (Castor canadensis) was introduced to islands adjacent to Argentina and Chile where they have become an invasive species. Discuss one ecological criterion (a basis for deciding) whether beavers are harmful or helpful to the ecosystems there.
▶️Answer/Explanation
Markscheme
I. female: «+» 0.04 «mg»
AND
II. male: «–» 0.12 «mg»
Both needed.
a. height of dam affects the temperature
b. high dams tend to cool the water
c. low dams tend to warm the water
d. pond 5/one pond shows no change/stays the same
a. trend lines support «the hypothesis»
OR
trend shows a negative correlation shown «between increased temperature and size»
Do not credit answers with just numbers.
Accept “line of best fit” wtte.
b. the trend line is shallow / small slope
OR
there is a large amount of scatter at higher temperatures (reducing the certainty)
OR
wide/overlapping ranges so no significant difference «(at» 9oC )
Note that it is only the trend line that indicates support.
c. (hypothesis not supported because) females in water over 10oC have the highest «mean dry» mass
Words other than “hypothesis not supported” may be used: “as opposed to”, “whereas”, to express deviation from support.
a. both flooding and tree felling increases bat passes/activity / WTTE
b. flooding has greater/increase on bat passes/activity / WTTE
OR
flooding has the greater impact than tree felling on bat passes
c. supporting argument from the data
a. arrow pointing from trout to human
b. arrows pointing from mayflies to trout and bats
Award [1 max] if answer does NOT show all 4 organisms.
bats and trout compete for mayflies
a. criterion
b. reason that beavers damage
c. reason that beavers help
eg,
a. biodiversity
b. if indigenous species are eliminated biodiversity is reduced, then the beavers would be seen as damaging
c. if biodiversity increases (due to the engineering of waterways), then beavers could be a benefit
Consider criteria something that may be dealt with from a range of perspectives.
Other possible criteria: abiotic disturbance changes to food webs diversity
Question
The biodiversity of insects worldwide is in decline. Destruction of habitats, pollution and climate change have contributed to the decline in global insect populations and to the extinction of insect species. A comprehensive literature review was carried out to determine the annual global rate of decline in insect species. The graph shows the results for three major orders of terrestrial insects and the total decline in insect biomass worldwide.
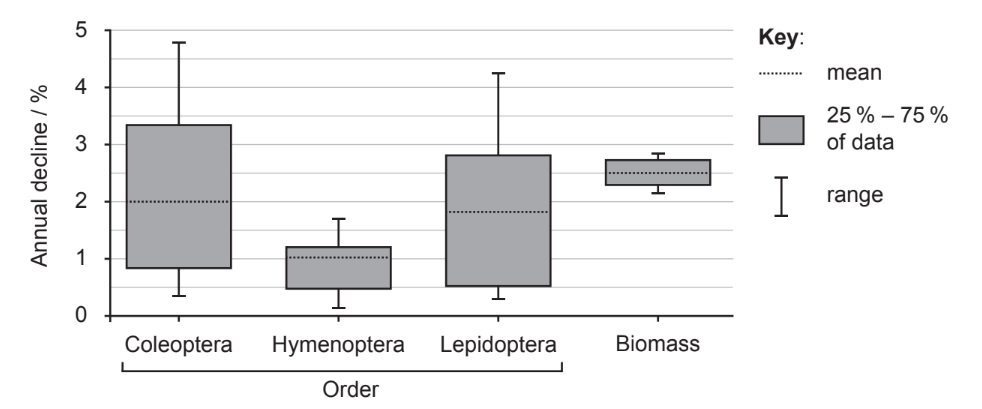
(a) State the mean annual decline in insect biomass.[1]
(b) Compare and contrast the results for Hymenoptera and Lepidoptera.[2]
(c) Calculate the number of Coleoptera species that would be expected to exist after one year from a starting number of 400000 species, assuming the mean rate of decline. [1]
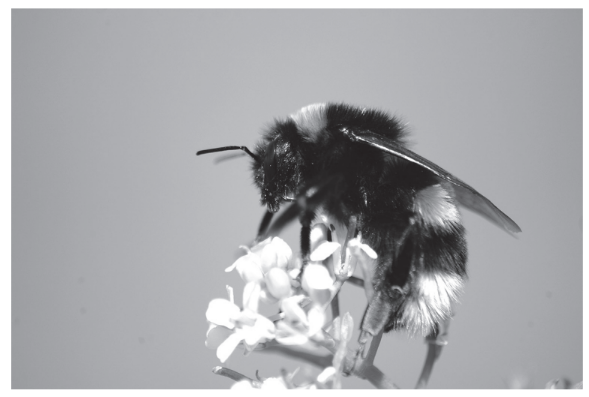
One species of the order Hymenoptera is the buff-tailed bumblebee (Bombus terrestris), which feeds on pollen and nectar obtained from specific plants.
Destruction of preferred habitats has affected the size of bumblebee populations and for survival, bumblebees have to feed on pollen from other available plant habitats. To simulate different pollens, researchers fed bumblebees on eight diets consisting of a mixture of proteins and lipids in different ratios $(P: L)$. The bumblebees also had access to sucrose. There was no restriction on the amount of each food the bumblebees could consume. The chart shows the mean daily mass of food eaten for eight diets with different $P: L$ ratios.
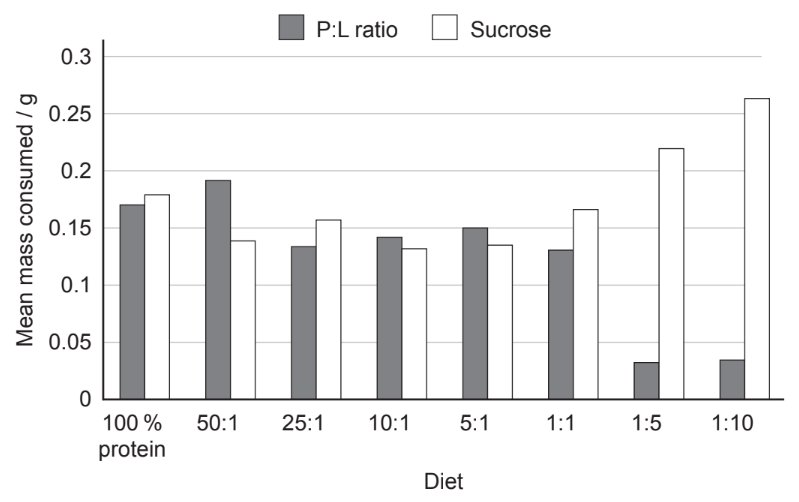
(d) Identify in how many of the diets sucrose was the greatest mass of food consumed. [1]
(e) Compare and contrast the results for the 1:1 and the 1:10 P:L diets. [2]
(f) Calculate the mass of lipid eaten when the bumblebees were presented with the 5:1 diet. [1]
(g) Suggest a reason that the mass of protein and lipid mixture eaten at 25:1 is lower than at 50:1. [1]
The graph shows the percentage of bumblebees that survived each day while being fed on different P:L diets. For each trial, n = 15.
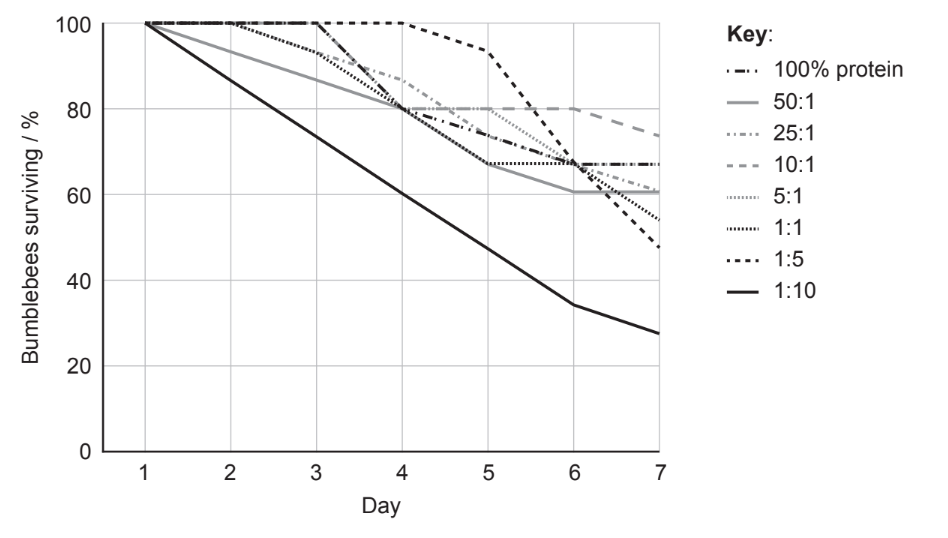
(h) State the relationship between high lipid content and survivability on day 7. [1]
(i) Suggest with a reason which P:L diet is closest to the normal diet of these bumblebees. [1]
(j) Discuss whether these studies show that habitat destruction can affect global bumblebee numbers. [2]
▶️Answer/Explanation
2.5 %; %
b a. both show a decline in number;
b. the mean decline for Hymenoptera is less than the mean for Lepidoptera
OR
there is a wider range of decline among the species of Lepidoptera;
c 392000 (species);
d 5;
e a. in both a greater mass of sucrose was eaten (than of the P:L mixture)
OR
the total mass eaten by both groups is the same/very similar;
b. the mass of sucrose eaten in the 1:10 mixture diet is greater than in the 1:1 diet
OR
the mass of the P:L mixture eaten in the 1:10 is less than in the 1:1;
f 0.025g; Unit needed 1
g a. the mixture was closer to what the bees ate naturally;
b. the bees like the taste better/prefer sucrose;
c. there was more lipid in the 25:1 mixture so they achieved their daily lipid/energy requirement with less mass of food;
d. the bees eating 50:1 diet ate more to reach their daily lipid requirement;
e. prefer the higher proportion of protein (in the 50:1)
h the higher the lipid content, the fewer bees survived/negative correlation;
i 10:1 diet as this has the highest survival rate (after 7 days);
j a. habitat destruction removes the plants/flowers/natural food source of the bees;
b. bees have to look for other food sources;
c. many of these alternative sources of food are not suitable for bee survival
OR
pollen with a different proportion of protein to lipid would reduce survival;
d. no control where bees are fed their normal diet is included;
e. simulation is not using natural pollen / habitat;
OR
sample size is too small to make conclusions;