Question
The enzyme ATP synthase has an essential role in aerobic cell respiration.
The sketch shows the relationship between the reaction rate and substrate concentration in the presence and the absence of a competitive inhibitor.
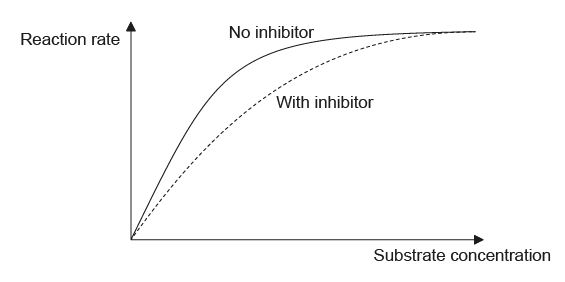
Explain the effect of the competitive inhibitor on the reaction rate.
Describe its location.
Describe its function.
▶️Answer/Explanation
Markscheme
a. competitive inhibitor «slows the reaction rate as it» competes for the active site
OR
competitor has similar shape/structure/composition to substrate «and slows the reaction rate»
b. binding of competitor is reversible
c. «as the substrate concentration increases» more substrate binds to the active site than the competitor «and reaction rate increases»
d. «as the substrate concentration increases» the reaction rate reaches the maximum plateau «same as with no inhibitor»
the inner mitochondrial membrane critstae/thylakoid membrane
a. protons build up in the intermembrane space due to electron transport chain OWTTE
b. protons move through ATP synthase down the concentration gradient
Accept H+ ions in place of protons
c. catalyses formation of ATP OWTTE
Question
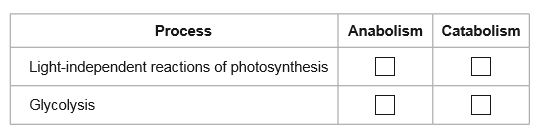
Identify the following processes as either anabolism or catabolism by placing a tick (√) in the correct box.
Outline the importance of enzymes to metabolic processes.
▶️Answer/Explanation
Markscheme
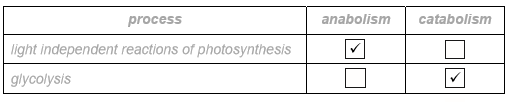
a. increase rate of reaction/speed up reaction
b. lower activation energy
c. a specific enzyme for each reaction/substrate
d. metabolic process/pathway blocked if an enzyme is inhibited/absent
e. end-product inhibition can control metabolic pathways
f. differences in metabolism as cells produce different enzymes during differentiation
Question
The diagram below shows the structure of lactase
A study of 600 adolescents in Sweden showed that milk consumption has a positive effect on height which shows continuous variation. However, milk contains lactose which some people can digest but some cannot.
State the pattern of inheritance that contributes to continuous variation.
Explain the production of lactose-free milk.
Identify the protein structures indicated by I and II.
I: ………………………………………………………
II: ………………………………………………………
Describe how structure I is held together.
This protein is described as a globular protein. Distinguish between globular and fibrous proteins.
▶️Answer/Explanation
Markscheme
polygenic / more than one gene
Accept polygenetic. Mark only first answer if more than one answer given.
lactase added to milk / lactase immobilised;
lactose hydrolysed/broken down into glucose and galactose;
for people who are lactose intolerant/lack lactase;
increases sweetness/solubility/smooth texture (in processed foods);
I is alpha helix and II is beta pleated sheet
Reject (α) double helix but accept α/A/a and β/B/b instead of alpha and beta.
hydrogen bonds;
Reject hydrogen and covalent bonds unqualified and hydrogen bonds between bases.
(hydrogen bonds) between N–H and C=O (on different amino acids);
Reject between amine and carboxyl groups.
(hydrogen bonds) between adjacent turns of the helix/every fourth amino
acid;
Accept above points in an annotated diagram.
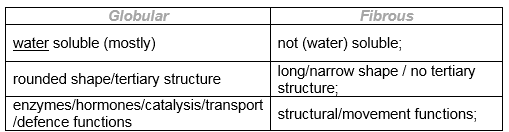
A table is not required but for each feature the difference between globular and fibrous proteins must be made clear.
Question
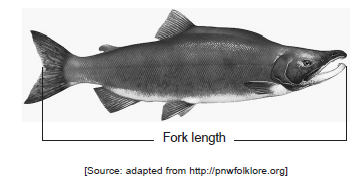
Sockeye salmon (Oncorhynchus nerka) spend the first years of their lives in the freshwater lakes of Alaska before migrating to marine waters. Their first months in marine waters are spent foraging and growing near the shore line. They then move to offshore regions of the North Pacific Ocean for 2 to 3 years.
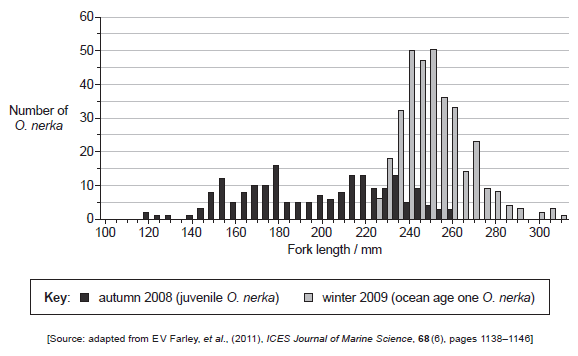
The graph shows fork length frequency of juvenile O. nerka caught during their first months in marine waters in autumn 2008 and ocean age one O. nerka caught 15 months later during winter 2009 in the North Pacific Ocean.
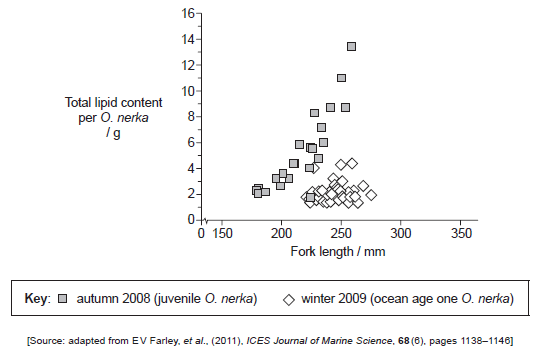
Lipid in O. nerka was measured to evaluate possible differences in energy status during their first 15 months at sea. The graph shows the relationship between fork length and lipid content for O. nerka caught during autumn 2008 and winter 2009.
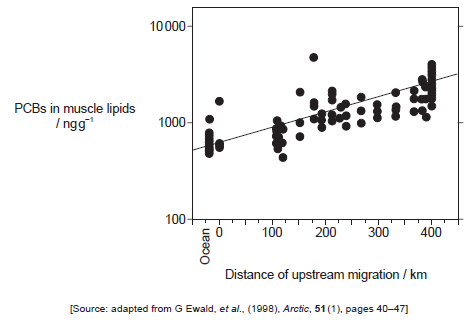
Persistent organic pollutants, such as polychlorinated biphenyls (PCBs), have been shown to reach unpolluted arctic areas by air currents. Another method of transport of these pollutants into these ecosystems is provided by migrating O. nerka.
Pollutant transport was studied in a population of O. nerka in the Copper River (Alaska). The graph shows concentration of PCBs in muscle lipids of O. nerka in relation to the distance of upstream migration.
Identify the total number of O. nerka with fork length from 240 to 245 mm caught in autumn 2008 and winter 2009.
Compare the data in the graph for autumn 2008 and winter 2009.
Suggest two factors that could affect the distribution of O. nerka in the North Pacific Ocean.
State the range of lipid content measured in O. nerka caught during autumn 2008.
…….g
Outline any correlation between total lipid content and fork length in autumn 2008 and in winter 2009.
Autumn 2008:
Winter 2009:
Suggest reasons for the differences in lipid content.
Describe the relationship between the distance of upstream migration and the concentration of PCBs in O. nerka.
State the concentration of PCBs in muscle lipids at 125 km from the ocean estimated by the correlation line.
As the O. nerka migrate upstream they no longer feed. Suggest a reason for the relationship of distance of upstream migration and concentration of PCBs in muscle lipids.
▶️Answer/Explanation
Markscheme
59 or 50 + 9
higher average/mean/mode/median length in winter;
higher minimum length in winter / none below 225 mm in winter;
higher maximum length in winter / none above 260 mm in autumn;
smaller range (of length) in winter;
higher peaks in winter;
overlap between lengths of 260 and 225 mm;
more data/more caught in winter than in autumn;
Allow the converse for any of the mark points.
Allow size instead of length and allow the two groups to be referred to either by season (autumn/winter) or year (2008/09).
migration;
ocean currents;
food availability/distribution;
predation / fishing;
temperature;
location of rivers (flowing into the ocean);
depth of (sea)water;
Reject “pollution” and mark only the first two responses.
11.7 g; (accept answers in the range of 11.4 to 13.0 g)
1.8 to 13.5 g; (accept answers in the range of 1.6 to 2.0 g and 13.4 to 13.6 g)
autumn 2008:
positive correlation / fork length increases as lipid content increases;
winter 2009:
no correlation / no overall trend; (reject “constant” or “almost same”)
lipid stores accumulated during summer/in freshwater/before moving out to sea;
food resources/availability may decline rapidly during autumn/winter;
more food close to the shore (than in offshore water);
lipid stores used up during winter / more active/migrating in winter;
Do not accept answers relating to the size of O. nerka because O. nerka with similar sizes showed different lipid content values.
direct/positive correlation / higher PCB concentration further up the river
1000 ng g–1 (accept answers in the range 950 ng g–1 to 1050 ng g–1)
Do not award the mark if the units are missing or incorrect.
Allow units shown as ng g-1.
lipids used up so same quantity of PCB in smaller amount of lipid;
no excretion of lipids so same quantity of PCB in smaller amount of lipid;
PCB absorption through gills;