Question
Auxin can be used to promote the development of roots from stem and leafy cuttings in some plants. In a study into the distribution of auxin in the development of these roots, scientists measured the amount of auxin in different leaves of a shoot tip of Petunia hybrida.
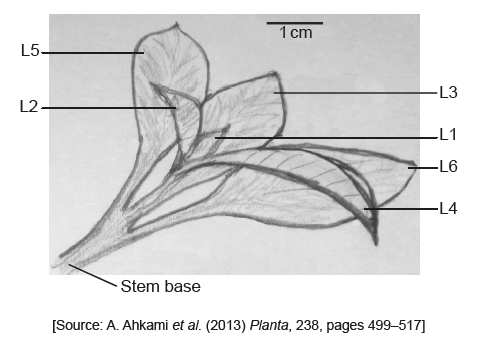
The figure indicates the numbering of leaves on the shoot, from L1 as the youngest and smallest to L6 as the largest and oldest leaf. The developmental stage of L5 and L6 was very similar, so L5 was not analysed. The stem base is the lowest part of the cutting where roots may form.
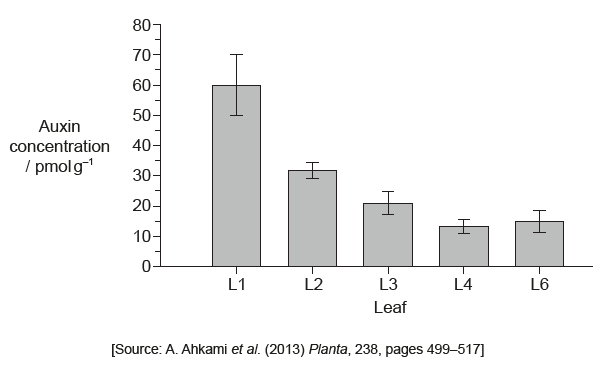
The graph shows the auxin concentration in the different leaves.
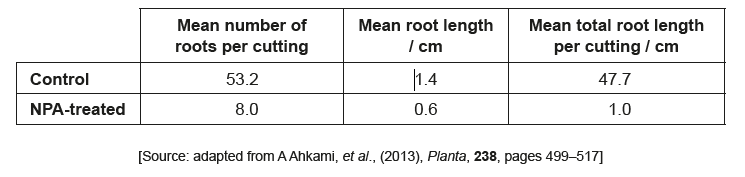
N-1-naphthylphthalamic acid (NPA) is an inhibitor used to block auxin transport. NPA was sprayed onto the leaves of a set of cuttings for 14 days. Development of the roots in control (non-treated) and NPA-treated cuttings was measured 14 days after taking the cuttings.
The table shows the influence of NPA on rooting.
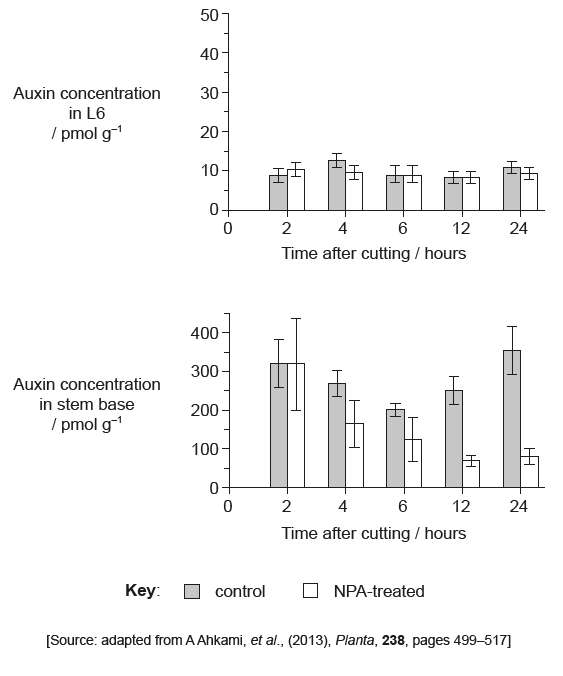
The scientists also measured the changes in auxin concentration in L6 and the stem base during the early period of root formation. They recorded the concentration in the control and NPA-treated cuttings for 24 hours after taking the cuttings.
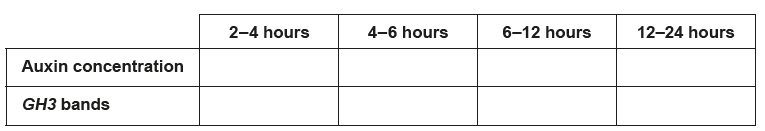
The scientists wanted to know whether the accumulation of auxin over time in the stem base of the controls affected expression of the GH3 gene, known to have a role in growth regulation in different plants. The technique that was used to quantify the level of transcription of the GH3 gene was Northern blotting. In this procedure the darkness
and thickness of the band is an indicator of the level of transcription of a particular gene. The image shows the result of the Northern blot from 2 hours to 24 hours after cutting.

Calculate the difference in the concentration of auxin found in L1 and L6.
. . . . . . . . . . . . . . . . . . pmol g–1
Identify the relationship between the concentration of auxin and the age of the different leaves.
Analyse the effect of NPA on the formation of roots.
Compare and contrast the changes in auxin concentration in the stem base over time for the control and NPA-treated cuttings.
Deduce the effect of NPA on auxin transport between L6 and the stem base.
Based on all the data presented and your knowledge of auxin, discuss the pattern of auxin production and distribution in the leaves and the possible relationship to root formation in leafy cuttings of Petunia hybrida.
State the name of the molecule which is produced by transcription.
Compare the pattern of GH3 transcription with the pattern of auxin concentration in the stem base control cuttings. You may use the table provided to help you to record the patterns before you compare them. (Please note: a simple
comparison in the table will not gain marks)
The scientists concluded that auxin activates the transcription of the GH3 gene. Using the information on the auxin concentration in the stem base in the graph and the Northern blot, evaluate whether this conclusion is supported.
▶️Answer/Explanation
Markscheme
45 «pmol g–1»
Allow answers in the range of 44 «pmol g–1» to 46 «pmol g–1».
less auxin as the leaves become older/larger Vice versa
OR
negative correlation from L1 to L4
L4 and L6 leaves have least auxin concentration
OR
L4 and L6/older leaves have about the same concentration of auxin/do not have significantly different concentrations
a. NPA decreased the «mean» number of roots per rooted cutting «by about 5» OWTTE
b. NPA decreased the «mean» length per root «by more than half»
c. NPA decreased the «mean» total root length per planted cutting «to about 2 % of control» OWTTE
d. NPA inhibited the formation of roots
OR
decreased all three measures
Accept other correct statements of overall changes in values.
The word “mean” is not required.
a. both decrease up to 6 hours/initially
b. NPA-treated decrease more/at a faster rate than control «up to 6 hours»
c. after 6 hours, control increases while NPA treated continues to fall
a. NPA «appears to have» no effect on concentrations/transport of auxin in L6 as control and NPA-treated remain at same «low» level
OWTTE
A valid reason must be given for the mark.
b. NPA «probably» inhibits the auxin efflux pumps/transport «in the leaves» as the levels drop in NPA-treated in stem base «but not in control»
OWTTE
A valid reason must be given for the mark.
c. the transport of auxin to the stem base must occur from younger leaves
OR
L6 is not the source of auxin in the stem base
d. NPA inhibits the auxin pumps/transport «in the leaves» as the levels drop in NPA-treated in stem base
a. L1 has the highest concentration of auxin so appears to be/is the main source/the producer of auxin
b. as leaves age, they «appear to» decrease the production of auxin
Vice versa
c. the stem base is an auxin sink as seen by the accumulation in the control stem base «where roots form»
OWTTE
d. high concentration of auxin «in the stem base» promotes root formation
Vice versa
mRNA/RNA
a. at 2 and 24 hours, auxin levels are similar and at 2 and 24 hours GH3 levels are similar
b. the pattern for the formation of auxin is similar to the pattern of transcription of the GH3 gene
OR
both decrease and then increase
c. «however» there is a lag between the peaks of the GH3 transcription and the peaks of auxin
A comparison must be made to award marks. Do not award marks for simple completion of the table.
a. the data «partially» supports the conclusion
OR
the relationship is not clear
b. the auxin concentration «seems to» rise before the transcription level increases
OR
there is a lag between auxin concentration changing and transcription level changing
OR
the auxin concentration falls before the transcription level falls
To award mp b, awareness of the lag should be demonstrated
c. more data is needed «before two hours/after 24 hours»
OWTTE