IB DP Chemistry - Structure 1.5 Ideal gases - IB Style Questions For HL Paper 1A -FA 2025

Question

Which row represents a gas that would show the least deviation from ideal gas behaviour?
GasPressureTemperature
A.          Phosphine, PH3LowHigh
B.           Ammonia, NH3LowHigh
C.         Phosphine, PH3HighLow
D.          Ammonia, NH3HighLow
▶️ Answer/Explanation
Detailed solution

Gases behave most ideally under:

  • Low pressure (molecules far apart, negligible intermolecular forces)
  • High temperature (high kinetic energy overcomes intermolecular forces)
  • Smaller, non-polar molecules deviate less than larger, polar molecules
  • PH3 is less polar than NH3

Answer: (A) – PH3 at low pressure and high temperature

Question

What is the molar mass of a gas according to the following experimental data?
experimental gas data diagram
Ideal gas constant = 8.31 \(JK^{-1} mol^{-1}\)
(A) \(\frac{40.0 \times 8.31 \times 290}{98 \times 0.220}\)
(B) \(\frac{98 \times 0.220}{40.0 \times 8.31 \times 290}\)
(C) \(\frac{40.0 \times 8.31 \times 17}{98 \times 0.220}\)
(D) \(\frac{98 \times 220}{40.0 \times 8.31 \times 17}\)
▶️ Answer/Explanation
Detailed solution

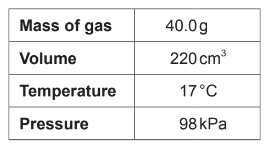
To calculate the molar mass of the gas, we start with the ideal gas law:
\[\mathrm{PV = nRT}\]

Rearranging to find the number of moles:
\[\mathrm{n = \frac{PV}{RT}}\]

Substituting the given values:
\[\mathrm{n = \frac{(98 \, kPa)(0.220 \, L)}{(8.31)(290\, K)}}\]

The molar mass \(M\) is then:
\[\mathrm{M = \frac{mass}{moles} = \frac{40.0}{n}}\]

Substituting the value of \(n\) gives:
\[\mathrm{M = \frac{40.0 \times 8.31 \times 290}{98 \times 0.220}}\]

Therefore:
Answer: (A)

Question

The volume \(V\) for a fixed mass of an ideal gas was measured at constant temperature at different pressures \(p\). Which graph shows the correct relationship between \(pV\) against \(p\)?
graphs of pV versus p for an ideal gas
▶️ Answer/Explanation
Detailed solution

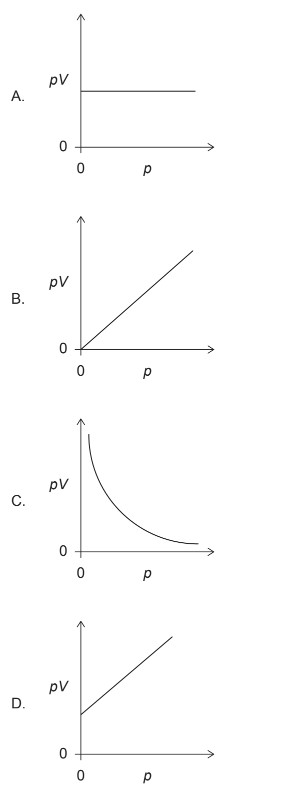
For a fixed mass of an ideal gas at constant temperature, Boyle’s Law states that:
\[ pV = \text{constant} \]

Since the product \(pV\) is constant, its value does not change as \(p\) changes. Therefore, a graph of \(pV\) (vertical axis) against \(p\) (horizontal axis) must be a horizontal line.

Among the given graphs, the only one that shows a constant value of \(pV\) as \(p\) increases is option (A).
Answer: (A)

Scroll to Top