Question
Simulation software can be used to produce a 3D visualization of rising sea levels that change as the user alters the percentage of ice that has melted.
Figure 3: 3D visualization of rising sea levels
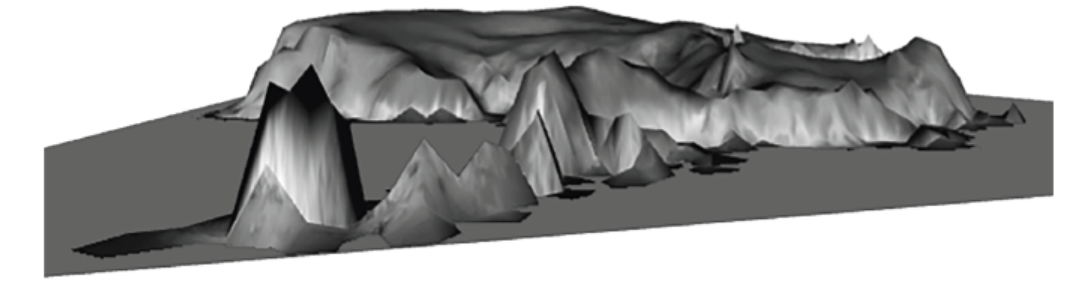
[Source: Courtesy NASA/JPL-Caltech.]
a.i.) Define the term visualization.[1]
a.ii.Identify how a 2D visualization could be used in this scenario.[1]
b. Explain the benefits of using visualization when simulating rising sea levels.[5]
c. Once the 3D visualization has been rendered, when the user drags a slider bar to simulate the amount of ice that has melted, the visualization is[6]
re-rendered without any delay.
Figure 4: Slider bar to simulate different percentages of sea ice
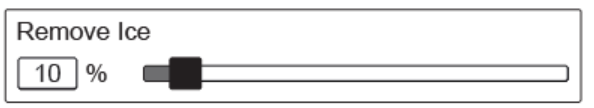
[Source: Courtesy NASA/JPL-Caltech.]
▶️Answer/Explanation
Ans:
a.i. )
A visualisation is graphical software technique that creates an image / diagram / graph to communicate data;
a.ii )
2D map of a coastline;
standard flat map;
cross-section of the land;
b. )
Visualizations provides a quick way of seeing where the sea levels are now and where they will be if the glaciers melt;
People can understand a visual image more easily than raw data;
No need to interpret figures so time is saved;
A visual of land being claimed by the water has greater emotional impact that raw data;
Public / politicians are more likely to be influenced by a visualization than raw data;
Accept other reasonable reasons.
c. )
Wireframe model is created with polygons;
The 3D rendering process automatically converts a 3D wireframe model into 2D images on a computer;
2D images are combined to create a 3D image;
3D renders may, or may not, use photorealistic effects;
It is likely that scanline rendering would be used because it uses less processing / system resources than ray tracing;
it is unlikely that ray tracing would be used because of the time taken for rendering;
Question
The QT Railway and QT Highway have recently been built to connect Qinghai with Tibet. This has made the mountainous region of Tibet accessible to the rest of China.
The endangered Tibetan antelope migrates over 300 km each year to give birth to a single calf. The QT Railway and QT Highway cross this migration route, see Figure 2.
Figure 2: Map of the study site and habitat of Tibetan antelope
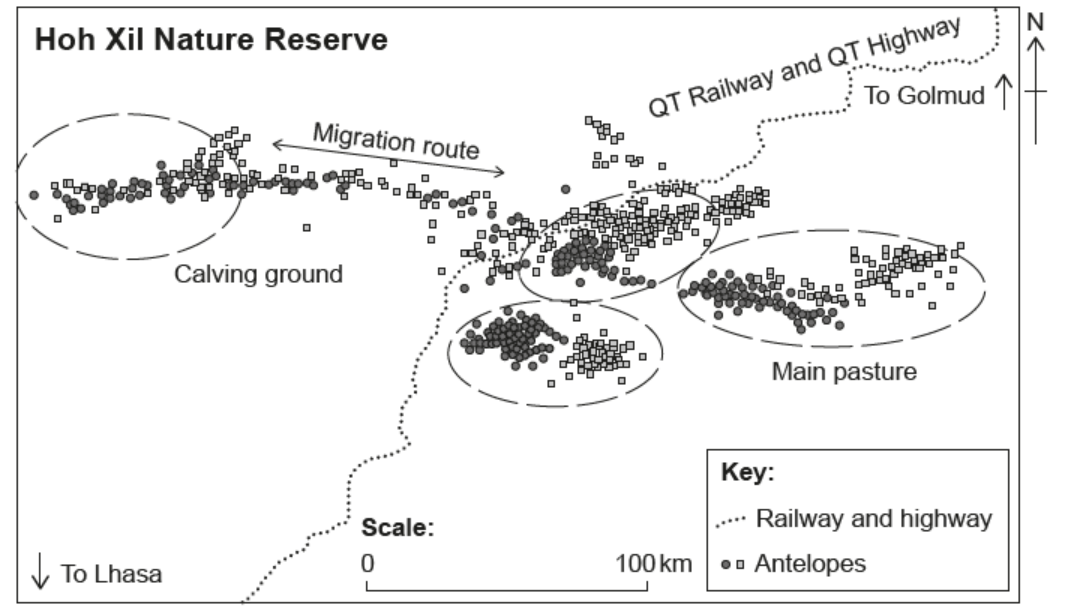
[Source: adapted (simplified redraw of the nature reserve data map) from Karina Manayeva, Buho Hoshino, Hiromasa lgota, Takashi Nakazawa and Ganzorig Sumiya, 2017. Seasonal migration and home ranges of Tibetan antelopes (Pantholops hodgsonii) based on satellite tracking. Int. J. Zool. Res., 13: 26-37. (c) 2017 Karina Manayeva et al.]
The building of the QT Railway and QT Highway presents potential dangers to both the antelopes and the public travelling through this nature reserve.
To understand more about the antelopes’ migration patterns, some antelopes have tracking devices attached. Using the information from these tracking devices, a 2D visualization model can be developed and updated in real time.
a. Identify four items of data that would be included to create the $2 \mathrm{D}$ visualization model.[4]
b. Explain why a 2D visualization model would be used rather than a $3 \mathrm{D}$ visualization model in this scenario.[4]
c. Explain why the development of a visualization model was necessary in this scenario.[4]
▶️Answer/Explanation
Ans:
a. )
Continuously collected data (from satellite, electronic trackers, observation);
Data on current speed of antelopes / length of time for the entire herd to pass a certain point;
Previous migration paths stored and used to provide additional data;
Predicted path calculated to determine when the antelopes will hit the railway line / highway;
Model may show the expected time of highway / railway inception updated in real time;
b. )
2D visualization gives a rapid way of seeing what is happening relative topositions on the map and updates quickly;
A 3D model may have delays updating providing information too late;
The antelope is always on the ground / in a $2 \mathrm{D}$ space
So there is no need to map in 3D space
2D visualization will update rapidly because it is less complex;
A 3D model that requires more powerful graphics cards (GPU);
c. )
Award [2 max] for technical difficulties of collecting data;
Award [2 max] for a reasonable solution to the problem
Difficult to put people on the ground to keep pace with the antelope;
Because the area is inhospitable / mountainous;
The antelope may cross the road at any point over a vast distance so the number of people required is prohibitive;
Poor visibility may affect visuals of antelopes / too dark for cameras;
Transmission may get disrupted in a remote place like Tibet;
So satellite transmissions as a back up system;