Production Possibilities Curve (PPC) – Assumptions of the Model
The Production Possibilities Curve (PPC) is a model used to show the maximum possible combinations of two goods that an economy can produce using its available resources efficiently.
To simplify analysis, the PPC model is based on a set of assumptions. These assumptions help isolate key economic concepts such as scarcity, choice, and opportunity cost.
Key Assumptions of the PPC Model: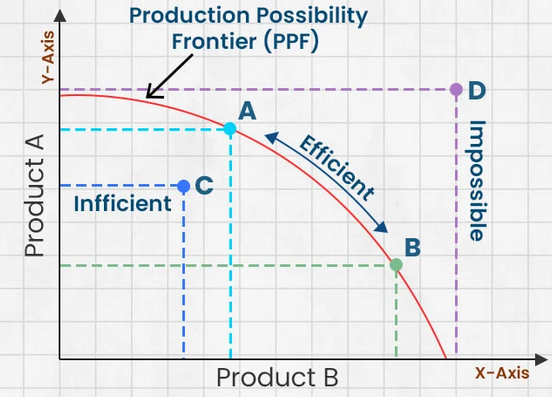
- Fixed quantity of resources — The amount of land, labour, capital, and entrepreneurship is constant.
- Full employment of resources — All available resources are fully and efficiently used.
- Fixed technology — The level of technology remains unchanged.
- Two goods only — The economy produces only two goods for simplicity.
- Resources are not perfectly adaptable — Resources cannot be easily switched between uses (important for increasing opportunity cost).
PPC assumes: Fixed resources + Full employment + Fixed technology
Explanation of Assumptions:
- Fixed resources ensure that production is limited, highlighting scarcity.
- Full employment means the economy is operating efficiently on the PPC.
- Fixed technology ensures that changes in output are due only to resource reallocation.
- Two goods assumption simplifies graphical representation and analysis.
- Imperfect resource mobility leads to increasing opportunity cost.
Implications of These Assumptions:
| Assumption | Economic Implication |
|---|---|
| Fixed resources | Creates scarcity and limits production |
| Full employment | Points on the PPC are efficient |
| Fixed technology | No shifts in the PPC |
| Two goods | Simplifies analysis of trade-offs |
| Imperfect resource mobility | Leads to increasing opportunity cost |
Example 1
Explain why the assumption of full employment is important in the PPC model.
▶️ Answer / Explanation
The assumption of full employment means that all available resources are being used efficiently.
This ensures that any point on the PPC represents the maximum possible output that the economy can produce.
If resources were not fully employed, the economy would operate inside the PPC, indicating inefficiency.
Therefore, this assumption allows the PPC to represent efficient production levels.
Example 2
Using the PPC model, explain the role of the assumption of fixed technology.
▶️ Answer / Explanation
The assumption of fixed technology means that production methods do not change during analysis.
This ensures that any movement along the PPC is due only to reallocating resources between goods.
If technology improved, the PPC would shift outward, showing economic growth rather than a trade-off.
Thus, fixed technology allows the PPC to focus on opportunity cost and choice.
Increasing versus Constant Opportunity Cost
Opportunity cost refers to the value of the next best alternative forgone when resources are reallocated. In the PPC model, opportunity cost can either be increasing or constant, depending on how easily resources can be transferred between different uses.
Increasing Opportunity Cost
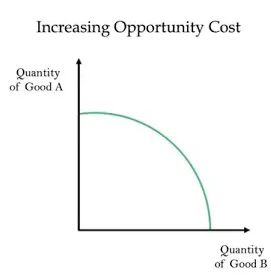
Increasing opportunity cost occurs when producing more of one good requires giving up increasingly larger amounts of another good. This happens because resources are not equally efficient in producing all goods.
- Resources are specialized and not perfectly adaptable.
- As production shifts, less suitable resources are used.
- Results in larger sacrifices of the alternative good.
- The PPC is concave (bowed outward).
More specialization → Higher opportunity cost
Constant Opportunity Cost
Constant opportunity cost occurs when producing more of one good requires giving up the same amount of another good each time. This happens when resources are perfectly adaptable between uses.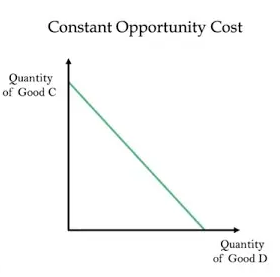
- Resources are equally efficient in all uses.
- No loss in productivity when switching production.
- Opportunity cost remains unchanged.
- The PPC is a straight line.
Perfect adaptability → Constant opportunity cost
Comparison Between Increasing and Constant Opportunity Cost:
| Aspect | Increasing Opportunity Cost | Constant Opportunity Cost |
|---|---|---|
| Resource Adaptability | Resources are specialized | Resources are perfectly adaptable |
| Opportunity Cost | Increases as more is produced | Remains constant |
| PPC Shape | Concave (bowed outward) | Straight line |
| Realism | More realistic | Less realistic |
Key Ideas:
- Increasing opportunity cost is due to resource specialization.
- Constant opportunity cost assumes perfect flexibility of resources.
- Most real-world economies experience increasing opportunity cost.
- The shape of the PPC reflects the nature of opportunity cost.
Example 1
Explain why the PPC is usually concave to the origin.
▶️ Answer / Explanation
The PPC is usually concave because of increasing opportunity cost.
As more of one good is produced, resources that are less suited for its production must be used. These resources were more efficient in producing the other good.
As a result, larger amounts of the alternative good must be sacrificed.
This increasing sacrifice causes the PPC to be bowed outward.
Example 2
Using an example, explain constant opportunity cost.
▶️ Answer / Explanation
Constant opportunity cost occurs when resources are equally efficient in producing both goods.
For example, if an economy can switch workers between producing wheat and rice without any loss of productivity, then producing more wheat will always require giving up the same amount of rice.
This results in a straight-line PPC, showing constant opportunity cost.
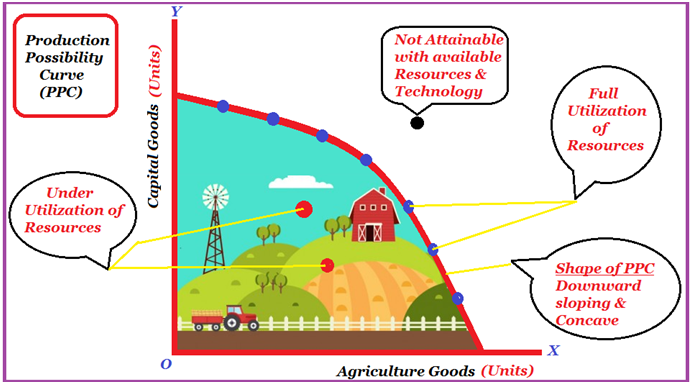
Production Possibilities Curve (PPC) – Features of the Model
The PPC model illustrates several key economic concepts such as scarcity, choice, opportunity cost, efficiency, unemployment, and economic growth. Each point on or around the curve represents different economic conditions.
Opportunity Cost
The PPC shows that producing more of one good requires sacrificing some quantity of another good. This trade-off represents opportunity cost.
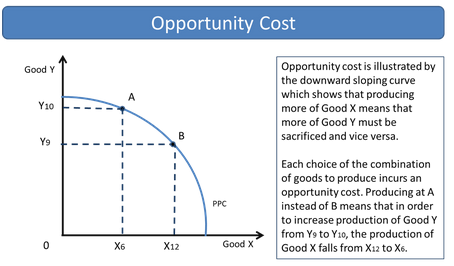
- Moving along the PPC involves reallocating resources.
- The slope of the PPC represents opportunity cost.
- Increasing opportunity cost results in a concave curve.
Scarcity
Scarcity is represented by the fact that production is limited to points on or inside the PPC. Points outside the curve are unattainable with current resources.
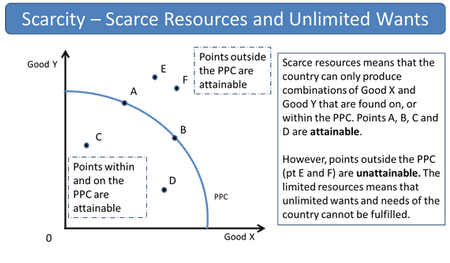
- The boundary of the PPC shows maximum production capacity.
- Points beyond the curve are not achievable.
- This reflects limited resources in the economy.
Choice
The PPC illustrates that an economy must choose between different combinations of goods.
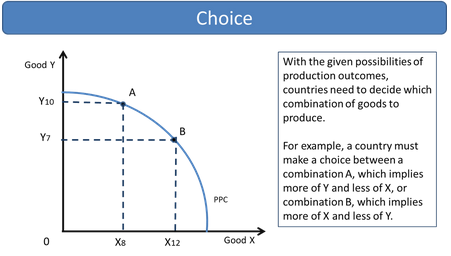
- Different points on the PPC represent different choices.
- Choosing one combination means giving up another.
- Movement along the curve shows trade-offs.
Unemployment of Resources
Points inside the PPC represent underutilization of resources, such as unemployment or inefficiency.
- Resources are not fully used.
- The economy is operating below its potential.
- Can occur due to recession or misallocation.
Efficiency
Points on the PPC represent efficient use of resources.
- Productive efficiency means maximum output from given resources.
- Allocative efficiency depends on producing the combination most desired by society.
- Any point inside the curve is inefficient.
Actual Growth
Actual growth occurs when an economy moves from a point inside the PPC to a point on the PPC.
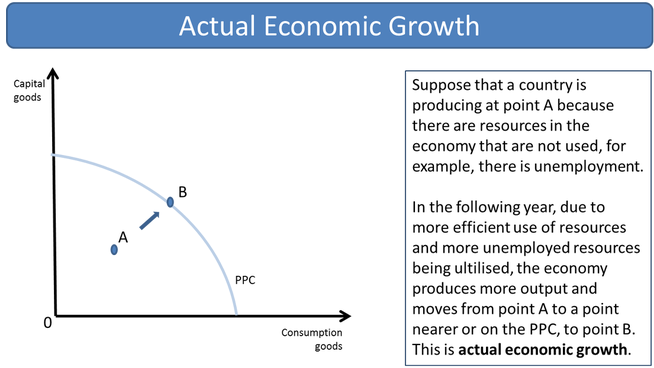
- Represents better utilization of existing resources.
- Can result from reduced unemployment or improved efficiency.
- Does not require an increase in resources.
Growth in Production Possibilities
Economic growth is shown by an outward shift of the PPC.
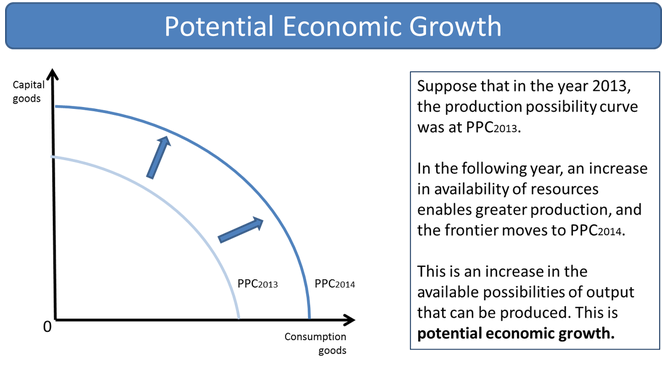
- Caused by increases in resources (land, labour, capital).
- Can result from technological improvements.
- Allows more goods and services to be produced.
Outward shift of PPC → Increase in productive capacity
Summary of PPC Features:
| Feature | Explanation |
|---|---|
| Opportunity Cost | Trade-off shown by movement along the PPC |
| Scarcity | Points outside the PPC are unattainable |
| Choice | Different points on the PPC represent different combinations |
| Unemployment | Points inside the PPC show underutilization |
| Efficiency | Points on the PPC show full and efficient use of resources |
| Actual Growth | Movement from inside to on the PPC |
| Economic Growth | Outward shift of the PPC |
Example 1
Using a PPC diagram, explain the difference between unemployment of resources and efficiency.
▶️ Answer / Explanation
On a PPC diagram, a point inside the curve represents unemployment or inefficient use of resources, as not all resources are being used.
A point on the curve represents efficient use of resources, where the economy is producing at its maximum potential.
Moving from inside the curve to a point on the curve shows improved efficiency and reduced unemployment.
Example 2
Explain the difference between actual growth and economic growth using the PPC model.
▶️ Answer / Explanation
Actual growth occurs when an economy moves from a point inside the PPC to a point on the PPC, indicating better use of existing resources.
Economic growth occurs when the PPC shifts outward due to an increase in resources or improved technology.
Thus, actual growth uses existing capacity more efficiently, while economic growth increases the economy’s capacity.