Allocative Efficiency at Competitive Market Equilibrium
Social (Community) Surplus Maximized at Equilibrium
Allocative efficiency occurs when the market produces the optimal quantity of a good such that total welfare in society is maximized. This happens at the competitive market equilibrium, where demand equals supply.
At equilibrium → Social surplus is maximized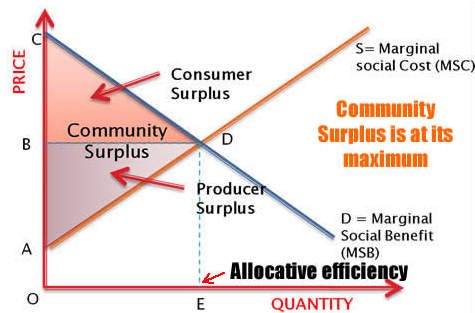
Explanation:
- At equilibrium, the quantity produced ensures that the sum of consumer and producer surplus is as large as possible.
- This means that all mutually beneficial trades between buyers and sellers have taken place.
- No additional units can be produced or consumed without reducing total welfare.
Why Social Surplus is Maximized:
- Consumers who value the good most (highest willingness to pay) are able to purchase it.
- Producers with the lowest costs are the ones supplying the good.
- This ensures resources are allocated to their most efficient use.
What Happens Away from Socially Efficient Equilibrium (Qe):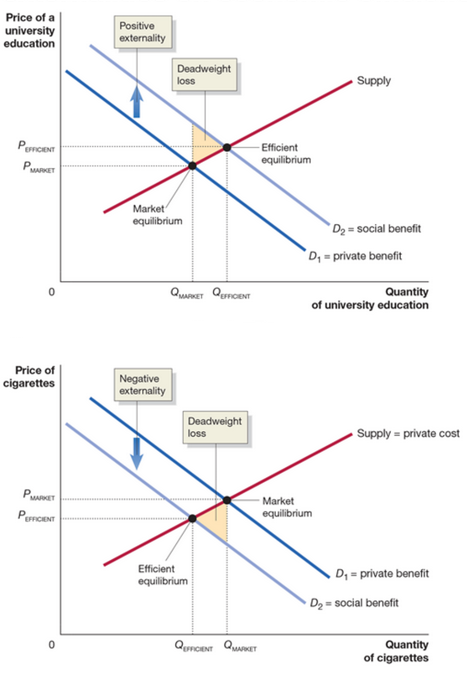
1. Underproduction (Q < Qe) — Positive Externality
- Occurs when market equilibrium output (Qmarket) is less than socially efficient output.
- Some beneficial trades do not occur.
- Social benefit (D₂) is greater than private benefit (D₁).
- Consumers and society value the good more than it costs to produce.
- This leads to a loss of potential surplus (deadweight loss).
2. Overproduction (Q > Qe) — Negative Externality
- Occurs when market equilibrium output (Qmarket) is greater than socially efficient output.
- Resources are used inefficiently.
- Social cost is greater than private cost (not fully reflected in the market).
- Cost of production exceeds the true benefit to society.
- This leads to a loss of surplus (deadweight loss).
Away from social optimum (Q ≠ Qe) → Deadweight loss
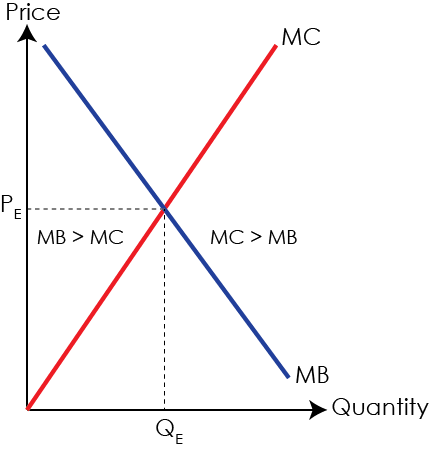
Graphical Insight:
- At equilibrium, total area between demand and supply curves is maximized.
- Any deviation creates a deadweight loss (welfare loss).
Key Points:
- Social surplus is maximized at equilibrium.
- All efficient trades occur at this point.
- Any deviation leads to welfare loss.
- Forms the basis of allocative efficiency.
Example 1
Explain why social surplus is maximized at market equilibrium.
▶️ Answer / Explanation
At equilibrium, quantity demanded equals quantity supplied.
This ensures that all consumers who are willing to pay at least the cost of production can buy the good.
Thus, all mutually beneficial trades occur.
As a result, total surplus is maximized.
Example 2
Evaluate the welfare effects of producing above the equilibrium quantity.
▶️ Answer / Explanation
If production exceeds equilibrium, the cost of producing additional units is higher than the benefit to consumers.
This leads to inefficient use of resources.
The extra units reduce total social surplus.
This creates deadweight loss.
Thus, overproduction results in inefficiency.
Allocative Efficiency at Competitive Market Equilibrium
Marginal Benefit (MB) = Marginal Cost (MC)
Allocative efficiency occurs when the marginal benefit (MB) of consuming a good is equal to the marginal cost (MC) of producing it. This condition is satisfied at the market equilibrium.
Allocative efficiency → MB = MC
Meaning of MB and MC: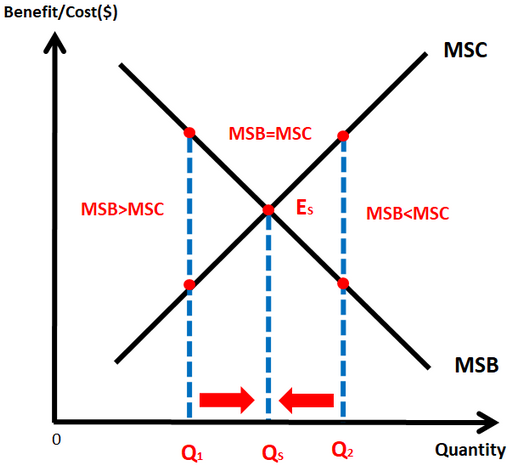
- Marginal benefit (MB) is the additional benefit gained from consuming one more unit of a good.
- It is represented by the demand curve (willingness to pay).
- Marginal cost (MC) is the additional cost of producing one more unit of a good.
- It is represented by the supply curve.
Why MB = MC Ensures Efficiency:
- When MB = MC, the benefit to consumers from the last unit equals the cost of producing it.
- Resources are used in the most efficient way.
- There is no waste or missed opportunity for additional welfare.
What Happens When MB ≠ MC:
1. Underproduction (MB > MC)
- The benefit of producing more units exceeds the cost.

- More output should be produced.
- Society loses potential welfare.
2. Overproduction (MB < MC)
- The cost of producing extra units exceeds the benefit.
- Too many resources are used.
- This creates inefficiency and welfare loss.
MB ≠ MC → Deadweight loss
Graphical Interpretation:
- The demand curve represents MB.
- The supply curve represents MC.
- Their intersection gives the allocatively efficient quantity.
- Any deviation creates deadweight loss.
Economic Logic (HL Insight):
- Competitive markets naturally move toward MB = MC.
- This ensures maximum social surplus.
- However, in the presence of externalities or market failure, MB may not equal social benefit, leading to inefficiency.
Example 1
(i) Explain why allocative efficiency occurs when MB = MC.
(ii) Evaluate the consequences of producing where MB is greater than MC.
▶️ Answer / Explanation
(i)
Allocative efficiency occurs when the benefit to consumers from the last unit equals the cost of producing it.
This means no additional gains can be made from producing more or less.
Thus, resources are allocated efficiently.
(ii)
If MB is greater than MC, society values the good more than it costs to produce.
This indicates underproduction.
Increasing output would increase total social surplus.
Thus, the market is not allocatively efficient.
Example 2 ( For HL- Only)
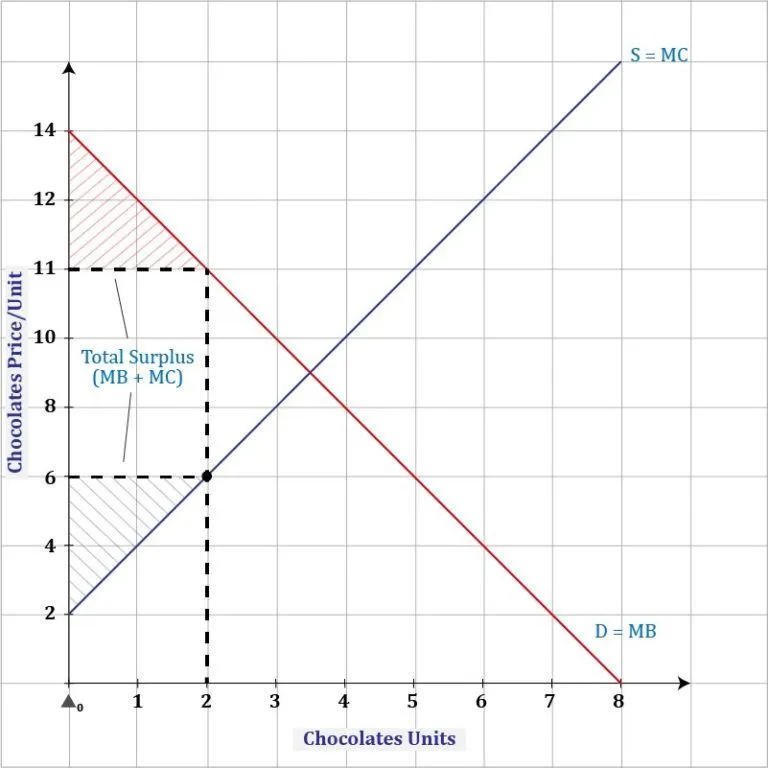
The chocolate market has the following supply and demand structure:
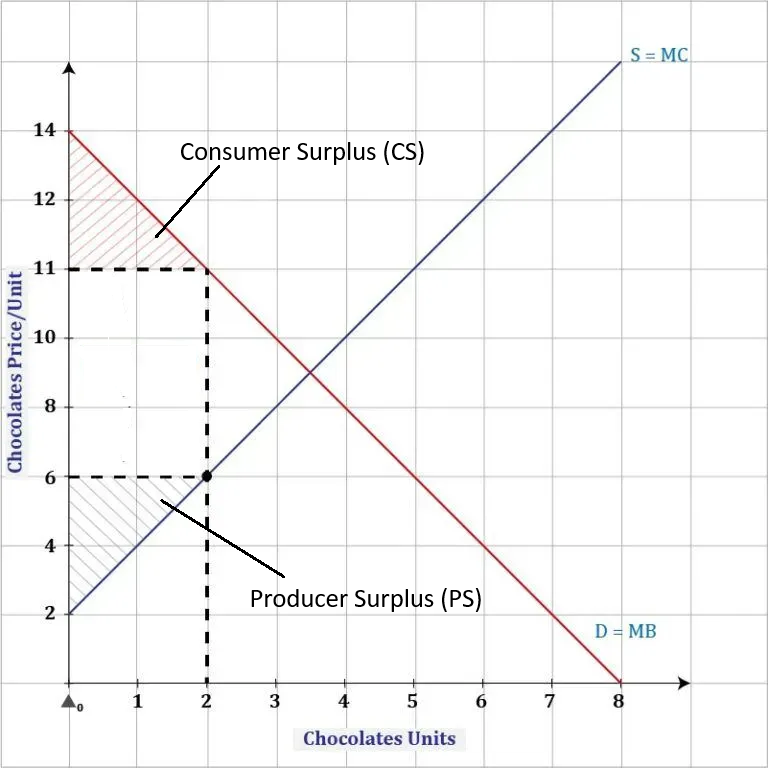
- Demand curve (MB): P = 14 − 1.5Q
- Supply curve (MC): P = 2 + 2Q
- Market quantity exchanged: Q = 2 units
- Price paid by consumers: $11 per unit
- Price received by producers: $6 per unit
Using the graph above, calculate the Consumer Surplus (CS), Producer Surplus (PS), and Total Surplus (TS) at Q = 2 units.
▶️ Answer / Explanation
Part A — Consumer Surplus (CS)
Consumer surplus is the area above the price consumers pay and below the demand (MB) curve, from Q = 0 to Q = 2.
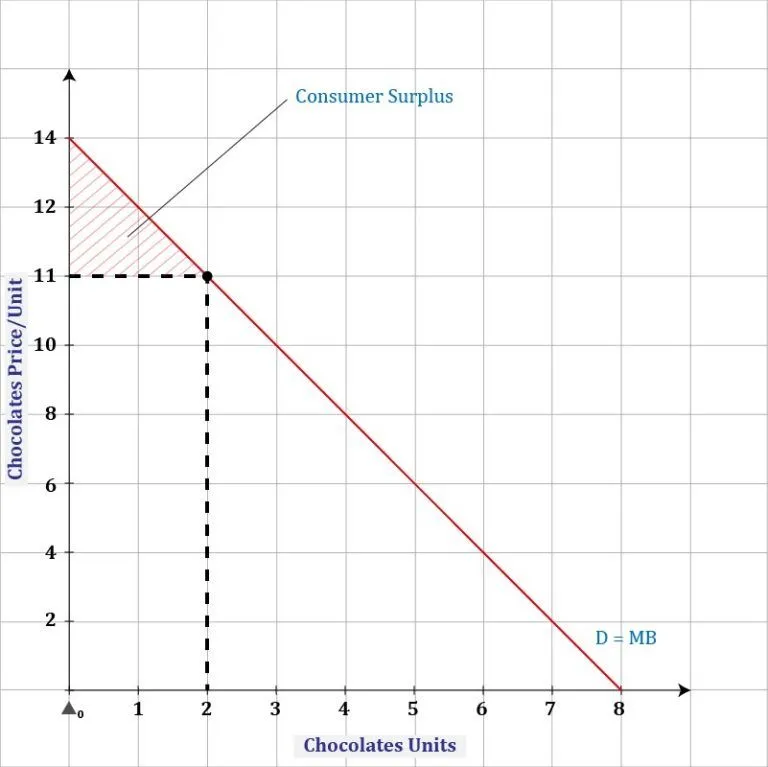
Step 1: Identify triangle dimensions
- Demand intercept (max willingness to pay) = \( \mathrm{14} \)
- Price paid by consumers = \( \mathrm{11} \)
- Height = \( \mathrm{14 – 11 = 3} \)
- Base = \( \mathrm{Q = 2} \)
Step 2: Apply formula
\( \mathrm{CS = \dfrac{1}{2} \times Base \times Height = \dfrac{1}{2} \times 2 \times 3} \)
Step 3: Calculate
\( \mathrm{CS = 3} \)
Final Answer: Consumer Surplus = $3
Part B — Producer Surplus (PS)
Producer surplus is the area below the price producers receive and above the supply (MC) curve, from Q = 0 to Q = 2.
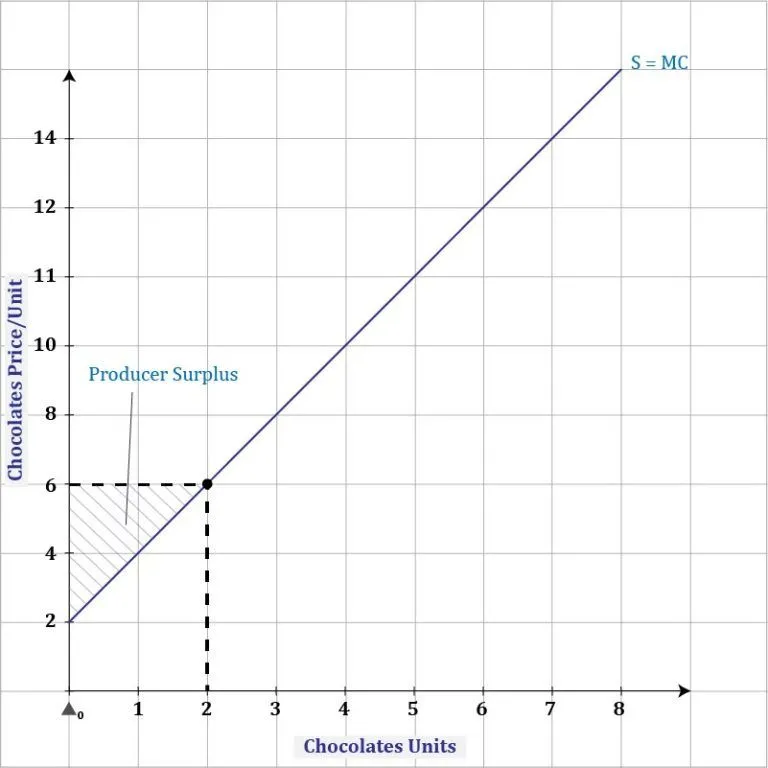
Step 1: Identify triangle dimensions
- Supply intercept (minimum price to produce) = \( \mathrm{2} \)
- Price received by producers = \( \mathrm{6} \)
- Height = \( \mathrm{6 – 2 = 4} \)
- Base = \( \mathrm{Q = 2} \)
Step 2: Apply formula
\( \mathrm{PS = \dfrac{1}{2} \times Base \times Height = \dfrac{1}{2} \times 2 \times 4} \)
Step 3: Calculate
\( \mathrm{PS = 4} \)
Final Answer: Producer Surplus = $4
Part C — Total Surplus (TS)
Total surplus is the sum of consumer and producer surplus, representing the total welfare gained from market exchange.
Step 1: Apply formula
\( \mathrm{TS = CS + PS} \)
Step 2: Substitute values
\( \mathrm{TS = 3 + 4} \)
Step 3: Calculate
\( \mathrm{TS = 7} \)
Final Answer: Total Surplus = $7