Shifting the Demand and Supply Curves to Produce a New Market Equilibrium
A change in market conditions, such as changes in demand or supply, causes the demand curve (D) or supply curve (S) to shift. This results in a new equilibrium price and quantity.
Shift in D or S → Disequilibrium → New equilibrium
General Mechanism of Adjustment
When a curve shifts, the market initially moves into disequilibrium, creating either:
- Excess demand (shortage)
- Excess supply (surplus)
These imbalances create pressure on price, which adjusts until a new equilibrium is reached.
1. Increase in Demand
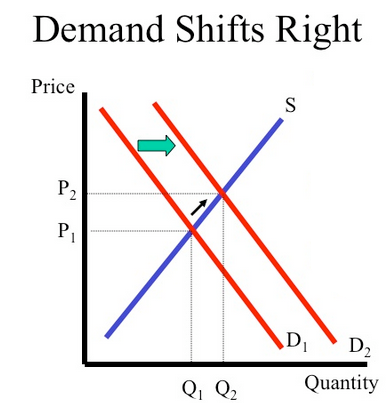
- Demand curve shifts right.
- At the original price, quantity demanded exceeds quantity supplied.
- This creates a shortage (excess demand).
- Consumers compete for limited goods, pushing prices up.
- Higher prices encourage firms to supply more.
- A new equilibrium is established at a higher price and higher quantity.
D ↑ → Shortage → Price ↑ → New equilibrium (P↑, Q↑)
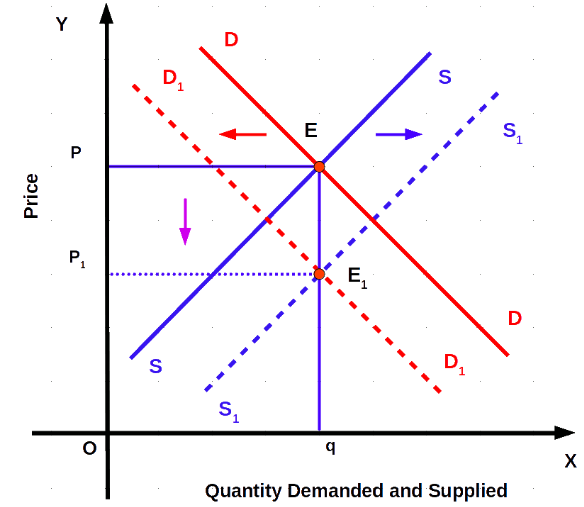
2. Decrease in Demand
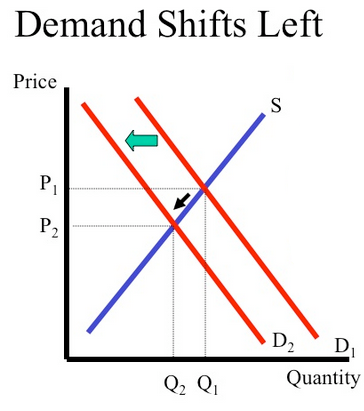
- Demand curve shifts left.
- At the original price, quantity supplied exceeds quantity demanded.
- This creates a surplus (excess supply).
- Firms lower prices to sell excess stock.
- Lower prices increase demand and reduce supply.
- A new equilibrium is established at a lower price and lower quantity.
D ↓ → Surplus → Price ↓ → New equilibrium (P↓, Q↓)
3. Increase in Supply
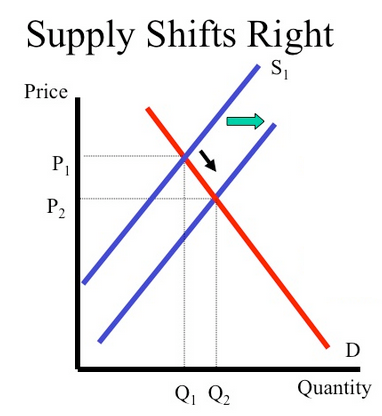
- Supply curve shifts right.
- At the original price, quantity supplied exceeds quantity demanded.
- This creates a surplus.
- Firms reduce prices to clear excess stock.
- Lower prices increase quantity demanded.
- A new equilibrium is reached at a lower price and higher quantity.
S ↑ → Surplus → Price ↓ → New equilibrium (P↓, Q↑)
4. Decrease in Supply
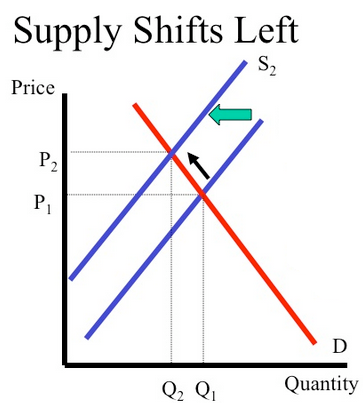
- Supply curve shifts left.
- At the original price, quantity demanded exceeds quantity supplied.
- This creates a shortage.
- Consumers bid up prices.
- Higher prices reduce demand and encourage supply.
- A new equilibrium is reached at a higher price and lower quantity.
S ↓ → Shortage → Price ↑ → New equilibrium (P↑, Q↓)
Simultaneous Shifts in Demand and Supply
Sometimes both the demand curve (D) and supply curve (S) shift at the same time. In such cases, the effect on equilibrium quantity and price depends on the relative magnitude (extent) of the shifts.
Both curves shift → Outcome depends on relative change
Case 1: Both Demand and Supply Increase (Rightward Shifts)
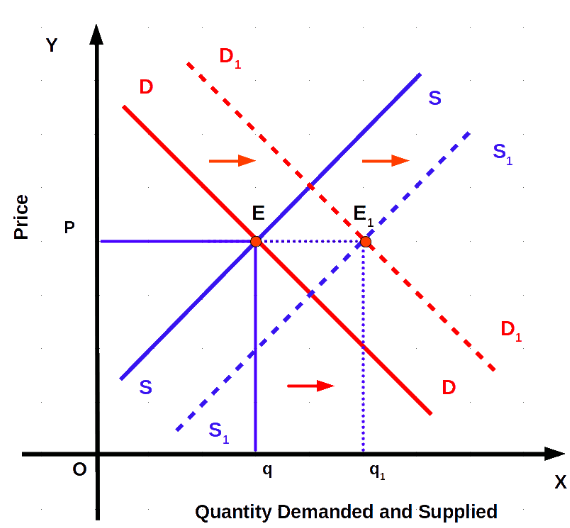
- Quantity: Definitely increases
- Price:
- Increases if demand increases more than supply
- Decreases if supply increases more than demand
- Remains unchanged if both increase equally
D ↑ & S ↑ → Q ↑, Price uncertain
Case 2: Both Demand and Supply Decrease (Leftward Shifts)
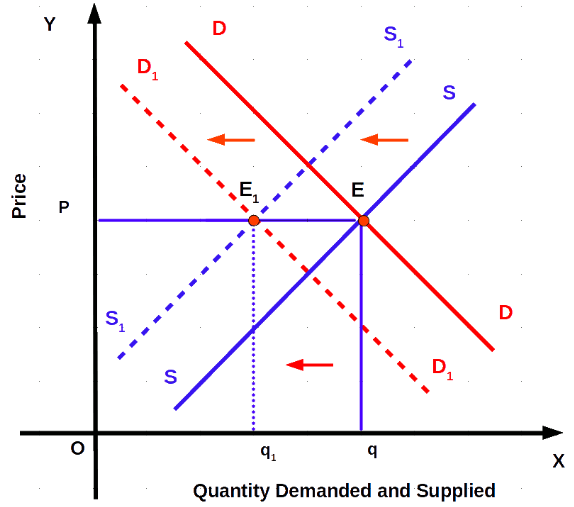
- Quantity: Definitely decreases
- Price:
- Increases if supply decreases more than demand
- Decreases if demand decreases more than supply
- Remains unchanged if both decrease equally
D ↓ & S ↓ → Q ↓, Price uncertain
Case 3: Demand Increases and Supply Decreases
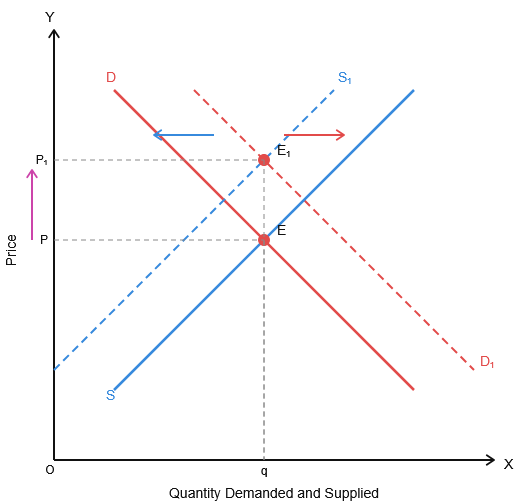
- Price: Definitely increases
- Quantity:
- May increase, decrease, or remain unchanged
- Depends on which shift is larger
D ↑ & S ↓ → Price ↑, Q uncertain
Case 4: Demand Decreases and Supply Increases
- Price: Definitely decreases
- Quantity:
- May increase, decrease, or remain unchanged
- Depends on which shift is larger
D ↓ & S ↑ → Price ↓, Q uncertain
Summary Table
| Change | Disequilibrium | Price Change | Quantity Change |
|---|---|---|---|
| Demand ↑ | Shortage | Increase | Increase |
| Demand ↓ | Surplus | Decrease | Decrease |
| Supply ↑ | Surplus | Decrease | Increase |
| Supply ↓ | Shortage | Increase | Decrease |
Key Ideas:
- Shifts in curves create disequilibrium in the short run.
- Shortages push prices up, while surpluses push prices down.
- The market naturally moves toward a new equilibrium.
- Understanding this process is essential for analysing real-world markets.
Example 1
Explain how an increase in demand leads to a new equilibrium using the concept of shortage.
▶️ Answer / Explanation
An increase in demand shifts the demand curve to the right.
At the original price, quantity demanded exceeds quantity supplied, creating a shortage.
Consumers compete, pushing prices up.
Higher prices encourage firms to increase supply and reduce demand.
A new equilibrium is reached at a higher price and quantity.
Example 2
Evaluate how an increase in supply leads to a new equilibrium using the concept of surplus.
▶️ Answer / Explanation
An increase in supply shifts the supply curve to the right.
At the original price, quantity supplied exceeds quantity demanded, creating a surplus.
Firms lower prices to sell excess output.
Lower prices increase demand and reduce supply.
A new equilibrium is reached at a lower price and higher quantity.
The extent of change depends on the price elasticity of demand and supply.