Price Elasticity of Demand (PED)
Changing PED Along a Straight-Line Downward Sloping Demand Curve (HL)
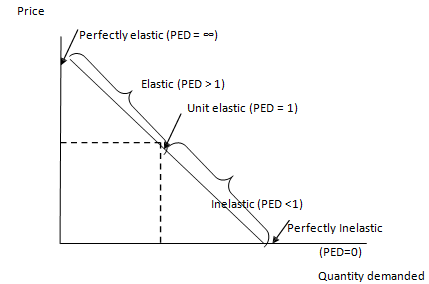
Even when a demand curve is a straight line, the value of PED is not constant. Instead, elasticity changes at different points along the curve.
Key Idea:
PED varies along the demand curve
- At different price and quantity combinations, responsiveness changes.
- The same straight-line curve can have elastic, unit elastic, and inelastic sections.
Explanation of Variation in PED
At the upper part of the demand curve:
- Price is high, quantity is low.
- A small change in price leads to a large percentage change in quantity.
- Demand is elastic (\( \mathrm{PED > 1} \)).
At the midpoint of the demand curve:
- Percentage change in price equals percentage change in quantity.
- Demand is unit elastic (\( \mathrm{PED = 1} \)).
At the lower part of the demand curve:
- Price is low, quantity is high.
- A change in price leads to a small percentage change in quantity.
- Demand is inelastic (\( \mathrm{PED < 1} \)).
Special Cases:
At the price-axis intercept:
- \( \mathrm{PED = \infty} \) (perfectly elastic)
At the quantity-axis intercept:
- \( \mathrm{PED = 0} \) (perfectly inelastic)
Diagram: Changing PED Along Demand Curve
Economic Logic (HL Insight):
- PED depends on relative percentage changes, not slope.
- Even though slope is constant, elasticity changes because:
- At high prices → small base quantity → large % change
- At low prices → large base quantity → small % change
Example 1
Explain why demand is elastic at the upper part of a demand curve.
▶️ Answer / Explanation
At the upper part, price is high and quantity demanded is low.
A small change in price results in a large percentage change in quantity demanded.
Therefore, PED is greater than 1 and demand is elastic.
Example 2
Evaluate how elasticity changes as price decreases along a linear demand curve.
▶️ Answer / Explanation
As price decreases, quantity demanded increases.
The percentage change in quantity becomes smaller relative to the base.
Therefore, PED decreases.
Demand changes from elastic to unit elastic at the midpoint, and then to inelastic.
This shows elasticity varies along the curve.