Determinants of Price Elasticity of Demand (PED)
The price elasticity of demand (PED) depends on several key factors that influence how responsive consumers are to price changes. These determinants explain why some goods have elastic demand while others are inelastic.
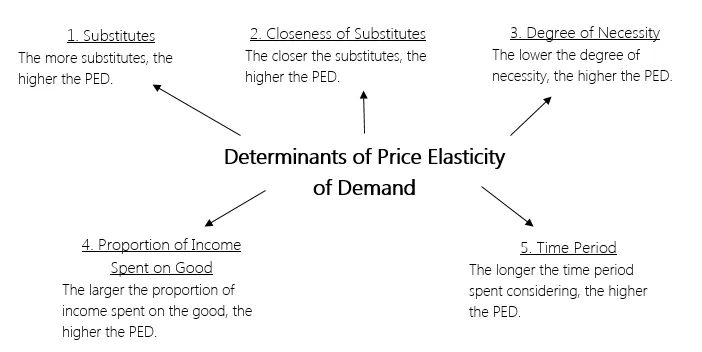
1. Number and Closeness of Substitutes
The availability of substitutes is one of the most important determinants of PED.
- If a good has many close substitutes, demand will be more elastic.
- If there are few or no substitutes, demand will be more inelastic.
Explanation:
- When price rises, consumers can easily switch to alternatives.
- The closer the substitute, the stronger the response.
- If no substitutes exist, consumers have limited choice and must continue buying.
More substitutes → More elastic demand
2. Degree of Necessity (Necessities vs Luxuries)
The nature of the good affects how consumers respond to price changes.
- Necessities → demand is inelastic
- Luxuries → demand is elastic
Explanation:
- Necessities are essential for survival or daily life, so demand does not change much.
- Luxuries are not essential, so consumers can reduce or delay consumption when price rises.
Necessity → Inelastic | Luxury → Elastic
3. Proportion of Income Spent on the Good
The larger the proportion of income spent on a good, the more elastic its demand tends to be.
- High proportion of income → demand is elastic
- Low proportion of income → demand is inelastic
Explanation:
- If a good takes up a large share of income, consumers are more sensitive to price changes.
- Small price changes significantly affect purchasing power.
- For low-cost items, price changes have little impact on consumer decisions.
Higher cost share → Higher responsiveness
4. Time
The time period considered affects elasticity.
- Short run → demand is more inelastic
- Long run → demand is more elastic
Explanation:
- In the short run, consumers cannot easily change habits or find alternatives.
- Over time, consumers adjust behaviour and find substitutes.
- This increases responsiveness to price changes.
More time → More elastic demand
Key Ideas:
- PED depends on consumer choice and flexibility.
- Substitutes and time are especially important determinants.
- Different goods have different elasticity due to these factors.
- Understanding determinants helps explain real-world demand behaviour.
Example 1
Explain why petrol tends to have inelastic demand in the short run but more elastic demand in the long run.
▶️ Answer / Explanation
In the short run, consumers rely on petrol for transport and have few alternatives.
This makes demand relatively inelastic.
In the long run, consumers can switch to public transport or electric vehicles.
This increases responsiveness, making demand more elastic.
Example 2
Evaluate how the availability of substitutes affects the elasticity of demand for a product.
▶️ Answer / Explanation
If a product has many close substitutes, consumers can easily switch when price rises.
This leads to a large fall in quantity demanded, making demand elastic.
If substitutes are limited, consumers continue purchasing despite price changes.
This makes demand inelastic.
Therefore, the number and closeness of substitutes strongly determine PED.
Relationship Between Price Elasticity of Demand (PED) and Total Revenue
Total revenue (TR) is the total income received by firms from selling a good.
\( \mathrm{TR = Price \times Quantity\ Demanded} \)
The effect of a change in price on total revenue depends on the price elasticity of demand (PED).
Key Idea:
Effect of price change on TR depends on elasticity
1. Elastic Demand (\( \mathrm{PED > 1} \))
- Quantity demanded is highly responsive to price changes.
- A fall in price leads to a large increase in quantity demanded.
- A rise in price leads to a large decrease in quantity demanded.
Effect on Total Revenue:
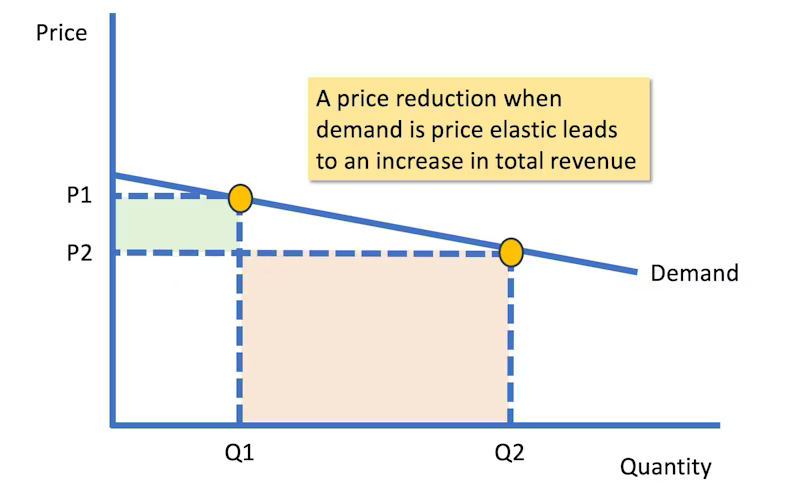
- Price ↓ → TR increases
- Price ↑ → TR decreases
Reason:
- The change in quantity outweighs the change in price.
2. Inelastic Demand (\( \mathrm{PED < 1} \))
- Quantity demanded is less responsive to price changes.
- A fall in price leads to a small increase in quantity demanded.
- A rise in price leads to a small decrease in quantity demanded.
Effect on Total Revenue:
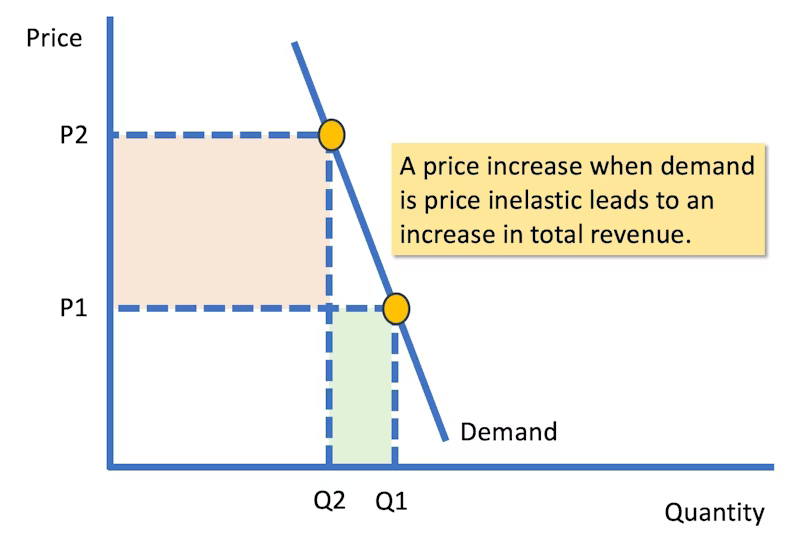
- Price ↓ → TR decreases
- Price ↑ → TR increases
Reason:
- The change in price outweighs the change in quantity.
3. Unit Elastic Demand (\( \mathrm{PED = 1} \))
- Percentage change in price equals percentage change in quantity demanded.
Effect on Total Revenue:
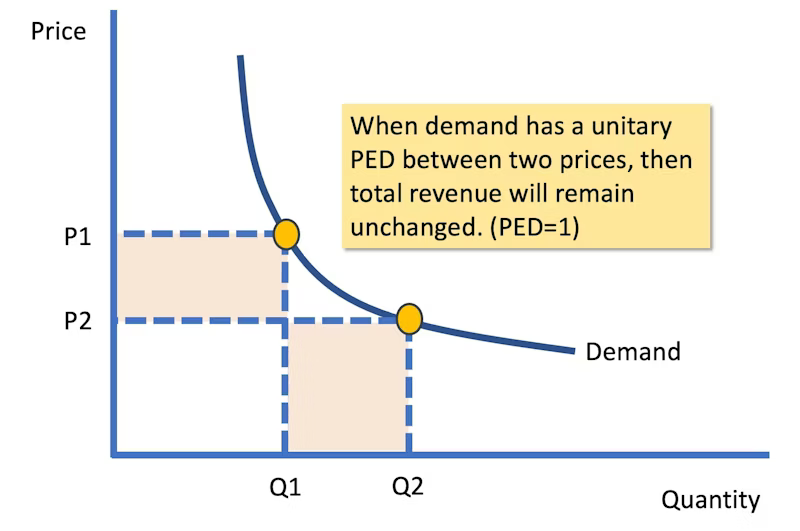
- Price change → TR remains constant
Reason:
- The increase in quantity exactly offsets the decrease in price (and vice versa).
Summary Table
| PED Value | Price Change | Effect on TR |
|---|---|---|
| \( \mathrm{PED > 1} \) | Price ↓ | TR ↑ |
| \( \mathrm{PED > 1} \) | Price ↑ | TR ↓ |
| \( \mathrm{PED < 1} \) | Price ↓ | TR ↓ |
| \( \mathrm{PED < 1} \) | Price ↑ | TR ↑ |
| \( \mathrm{PED = 1} \) | Any change | TR constant |
Graphical Insight :
- In the elastic region (upper part of demand curve), lowering price increases TR.
- In the inelastic region (lower part), lowering price decreases TR.
- Total revenue is maximized at unit elastic point (midpoint of linear demand curve).
Key Ideas:
- Elasticity determines how price changes affect revenue.
- Firms use PED to make pricing decisions.
- Understanding this relationship is crucial for profit strategies.
- Maximum revenue occurs where \( \mathrm{PED = 1} \).
Example 1
A firm reduces price and finds that total revenue increases. What can you conclude about PED?
▶️ Answer / Explanation
If price falls and total revenue increases, demand must be elastic.
This means \( \mathrm{PED > 1} \).
The increase in quantity demanded is proportionally larger than the fall in price.
Example 2
The price of a product falls from \( \mathrm{\$50} \) to \( \mathrm{\$40} \), and quantity demanded increases from \( \mathrm{100} \) units to \( \mathrm{140} \) units.
Calculate the price elasticity of demand (PED) and determine the effect on total revenue.
▶️ Answer / Explanation
Step 1: Calculate percentage change in price
\( \mathrm{\%\ \Delta P = \dfrac{40 – 50}{50} \times 100 = -20\%} \)
Step 2: Calculate percentage change in quantity demanded
\( \mathrm{\%\ \Delta Q_d = \dfrac{140 – 100}{100} \times 100 = 40\%} \)
Step 3: Calculate PED
\( \mathrm{PED = \left| \dfrac{40}{-20} \right| = 2} \)
Step 4: Determine effect on total revenue
Initial TR = \( \mathrm{50 \times 100 = 5000} \)
New TR = \( \mathrm{40 \times 140 = 5600} \)
Conclusion:
\( \mathrm{PED = 2 > 1} \), so demand is elastic.
Price falls → Total revenue increases.