Income Elasticity of Demand (YED)
YED = Percentage change in quantity demanded ÷ Percentage change in income
Definition
Income elasticity of demand (YED) measures how responsive the quantity demanded of a good is to a change in consumer income.

Explanation of the Formula
- \( \mathrm{\%\ \Delta Q_d} \) refers to the percentage change in quantity demanded.
- \( \mathrm{\%\ \Delta Income} \) refers to the percentage change in income.
- YED shows how demand changes as consumers become richer or poorer.
Understanding the Concept
- If income increases, demand for some goods will increase.
- If income decreases, demand may fall or rise depending on the type of good.
- YED helps classify goods into normal and inferior goods (next part).
Income change → Demand response
Important Note
- Unlike PED, YED can be positive or negative.
- The sign of YED is very important as it determines the type of good.
Key Ideas:
- YED measures responsiveness to income changes.
- It is a ratio of percentage changes.
- Used to classify goods and predict demand patterns.
- Important for firms planning for economic growth or recession.
Example 1
Income increases by 10% and quantity demanded increases by 20%. Calculate YED.
▶️ Answer / Explanation
\( \mathrm{YED = \dfrac{20}{10} = 2} \)
Demand is income elastic.
Example 2
The income of consumers increases from \( \mathrm{\$2000} \) to \( \mathrm{\$2500} \), and the quantity demanded of a good increases from \( \mathrm{80} \) units to \( \mathrm{120} \) units.
Calculate the income elasticity of demand (YED) and determine the type of good.
▶️ Answer / Explanation
Step 1: Calculate percentage change in income
\( \mathrm{\%\ \Delta Income = \dfrac{2500 – 2000}{2000} \times 100 = 25\%} \)
Step 2: Calculate percentage change in quantity demanded
\( \mathrm{\%\ \Delta Q_d = \dfrac{120 – 80}{80} \times 100 = 50\%} \)
Step 3: Calculate YED
\( \mathrm{YED = \dfrac{50}{25} = 2} \)
Conclusion:
\( \mathrm{YED = 2 > 1} \), so the good is a luxury good (income elastic).
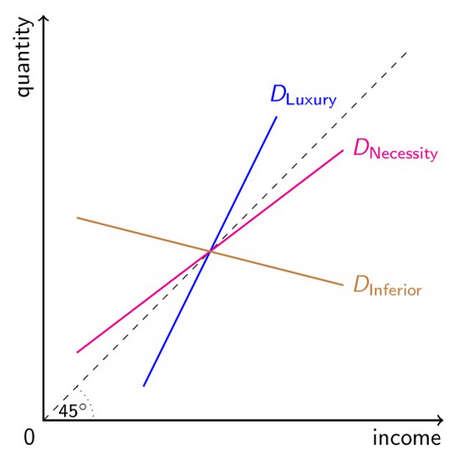
Income Elastic Demand and Income Inelastic Demand
The value of YED helps classify goods based on how demand responds to changes in income. This is important for understanding consumer behaviour and market trends.
1. Income Elastic Demand (\( \mathrm{YED > 1} \))
A good is said to have income elastic demand when a change in income leads to a more than proportionate change in quantity demanded.
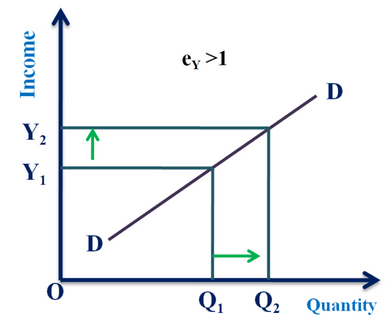
- \( \mathrm{YED > 1} \)
- Demand is highly responsive to income changes.
- Typically associated with luxury goods and services.
Explanation:
- As income increases, consumers spend proportionally more on these goods.
- These goods are not essential and are purchased more when consumers have higher disposable income.
- When income falls, demand drops significantly.
Income ↑ → Demand increases more than proportionately
Examples:
- Luxury cars
- International travel
- High-end electronics
2. Income Inelastic Demand (\( \mathrm{0 < YED < 1} \))
A good is said to have income inelastic demand when a change in income leads to a less than proportionate change in quantity demanded.
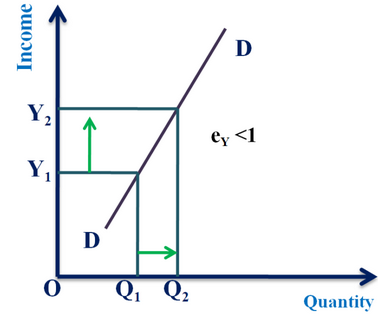
- \( \mathrm{0 < YED < 1} \)
- Demand is less responsive to income changes.
- Typically associated with necessities.
Explanation:
- Consumers will continue to buy these goods regardless of income changes.
- Even if income increases, consumption rises only slightly.
- These goods are essential for daily living.
Income ↑ → Demand increases less than proportionately
Examples:
- Basic food items
- Electricity
- Water
Key Differences:
| Aspect | Income Elastic Demand | Income Inelastic Demand |
|---|---|---|
| YED Value | \( \mathrm{YED > 1} \) | \( \mathrm{0 < YED < 1} \) |
| Responsiveness | High | Low |
| Type of Goods | Luxury goods | Necessities |
| Income Increase Effect | Large increase in demand | Small increase in demand |
Economic Insight:
- As economies grow, demand for luxury goods increases faster.
- Demand for necessities grows slowly and may stabilize.
- Firms use this to plan for economic expansion or recession.
Key Ideas:
- YED shows how demand responds to income changes.
- Luxury goods → elastic, necessities → inelastic.
- Important for predicting market growth.
- Helps firms target the right income groups.
Example 1
Explain why demand for luxury cars is income elastic.
▶️ Answer / Explanation
Luxury cars are non-essential goods.
As income increases, consumers can afford to spend more on such goods.
Demand increases more than proportionately compared to income.
Therefore, YED is greater than 1 and demand is income elastic.
Example 2
Evaluate why basic food items have income inelastic demand.
▶️ Answer / Explanation
Basic food items are necessities required for survival.
Even if income increases, consumption does not increase significantly.
Consumers only buy slightly more.
Thus, demand changes less than proportionately, so YED is between 0 and 1.
Therefore, demand is income inelastic.
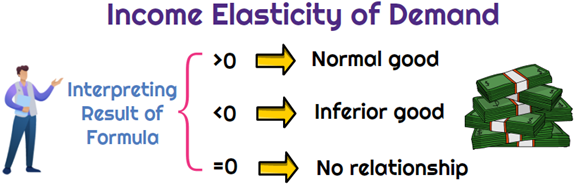
Significance of Sign
The sign (positive or negative) of YED is very important because it shows the type of good and how demand changes with income.
1. Positive YED (Normal Goods)
When YED is positive, demand moves in the same direction as income. 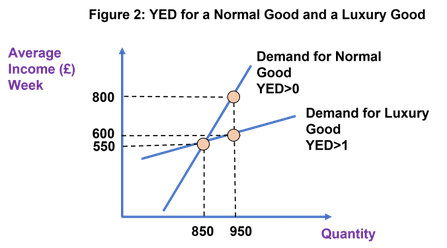
- \( \mathrm{YED > 0} \)
- As income increases, quantity demanded increases.
- As income decreases, quantity demanded decreases.
Explanation:
- These goods are called normal goods.
- Consumers buy more of these goods when their purchasing power rises.
- Includes both:
- Necessities (\( \mathrm{0 < YED < 1} \))
- Luxuries (\( \mathrm{YED > 1} \))
Income ↑ → Demand ↑
2. Negative YED (Inferior Goods)
When YED is negative, demand moves in the opposite direction to income.
- \( \mathrm{YED < 0} \)
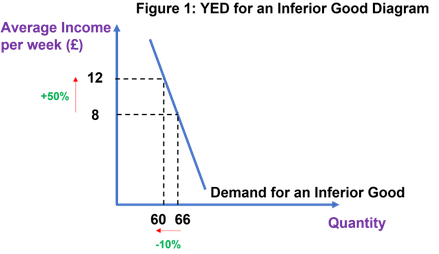
- As income increases, quantity demanded decreases.
- As income decreases, quantity demanded increases.
Explanation:
- These goods are called inferior goods.
- Consumers switch to better alternatives when income rises.
- When income falls, consumers rely more on these cheaper goods.
Income ↑ → Demand ↓
Key Differences:
| Aspect | Normal Goods | Inferior Goods |
|---|---|---|
| YED Sign | \( \mathrm{YED > 0} \) | \( \mathrm{YED < 0} \) |
| Income Increase | Demand increases | Demand decreases |
| Consumer Behaviour | Buy more as income rises | Switch away as income rises |
Economic Insight:
- The sign of YED helps firms identify market positioning.
- Normal goods benefit from economic growth.
- Inferior goods may see higher demand during economic downturns.
Key Ideas:
- Sign of YED determines the type of good.
- Positive → Normal goods, Negative → Inferior goods.
- Essential for understanding consumer behaviour.
- Important for firms planning during booms and recessions.
Example 1
Explain why demand for public transport may decrease as income rises.
▶️ Answer / Explanation
Public transport is often considered an inferior good.
As income rises, consumers can afford private cars or taxis.
They switch to these alternatives.
Thus, demand decreases, so YED is negative.
Example 2
Evaluate why demand for restaurant meals increases with income.
▶️ Answer / Explanation
Restaurant meals are normal goods.
As income increases, consumers have more disposable income.
They spend more on eating out.
Thus, demand increases, so YED is positive.
If the increase is large, the good may be income elastic.
Significance of Value (Magnitude of YED)
In addition to the sign, the magnitude (value) of YED is important because it shows the degree of responsiveness of demand to changes in income.
1. Less than One (\( \mathrm{0 < YED < 1} \)) — Necessities
When YED is between 0 and 1, demand is income inelastic.
- Quantity demanded changes less than proportionately compared to income.
- These goods are typically necessities.
Explanation:
- Consumers need these goods regardless of income.
- Even if income rises, consumption increases only slightly.
- When income falls, demand does not decrease significantly.
Income ↑ → Small increase in demand
Examples:
- Basic food items
- Electricity
- Water
2. Greater than One (\( \mathrm{YED > 1} \)) — Luxury Goods and Services
When YED is greater than 1, demand is income elastic.
- Quantity demanded changes more than proportionately compared to income.
- These goods are typically luxury goods and services.
Explanation:
- As income rises, consumers spend more on non-essential goods.
- Demand increases rapidly.
- When income falls, demand drops significantly.
Income ↑ → Large increase in demand
Examples:
- Foreign holidays
- Luxury cars
- Entertainment services
Key Comparison:
| YED Value | Type of Good | Response to Income Change |
|---|---|---|
| \( \mathrm{0 < YED < 1} \) | Necessities | Small change in demand |
| \( \mathrm{YED > 1} \) | Luxury goods/services | Large change in demand |
Economic Insight:
- As economies grow, spending shifts from necessities to luxuries.
- This explains changes in consumer patterns and economic development.
- Firms producing luxury goods benefit more from rising incomes.
Key Ideas:
- Magnitude of YED shows strength of responsiveness.
- \( \mathrm{0 < YED < 1} \) → necessities (inelastic).
- \( \mathrm{YED > 1} \) → luxury goods/services (elastic).
- Important for understanding consumer spending behaviour.
Example 1
A good has \( \mathrm{YED = 0.5} \). Explain what this indicates.
▶️ Answer / Explanation
\( \mathrm{0 < YED < 1} \), so the good is a necessity.
Demand increases less than proportionately with income.
Consumers will continue buying it regardless of income changes.
Example 2
A good has \( \mathrm{YED = 2} \). Evaluate its nature.
▶️ Answer / Explanation
\( \mathrm{YED > 1} \), so it is a luxury good.
Demand increases more than proportionately as income rises.
This indicates high responsiveness to income changes.
Such goods perform well during economic growth.
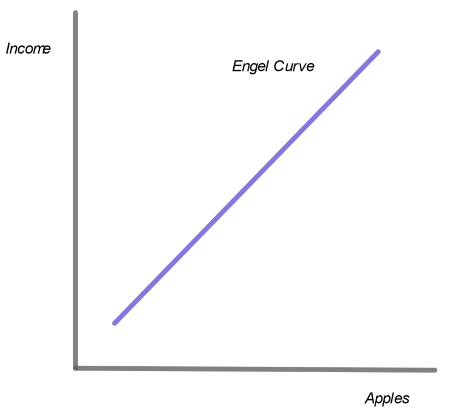
Engel Curves and Income Elasticity of Demand (YED)
An Engel curve shows the relationship between consumer income and quantity demanded of a good, holding other factors constant.
Link with YED
The shape of the Engel curve reflects the income elasticity of demand (YED) for a good.
- It shows how demand changes as income changes.
- Different goods have different Engel curve shapes depending on their YED.
1. Normal Goods (Positive YED)
For normal goods, demand increases as income increases.
- \( \mathrm{YED > 0} \)
- Engel curve is upward sloping.
Further distinction:
- Necessities (\( \mathrm{0 < YED < 1} \)):
- Curve increases at a decreasing rate.
- Demand rises slowly as income increases.
- Luxuries (\( \mathrm{YED > 1} \)):
- Curve increases at an increasing rate.
- Demand rises rapidly with income.
2. Inferior Goods (Negative YED)
For inferior goods, demand decreases as income increases.
- \( \mathrm{YED < 0} \)
- Engel curve is backward bending.
Explanation:
- At low income levels, demand increases.
- Beyond a certain income, consumers switch to better alternatives.
Diagram: Engel Curves

Economic Interpretation:
- Engel curves illustrate how consumer spending patterns change with income.
- They provide a graphical representation of YED.
- Used to analyse living standards and economic development.
Example 1
Explain how Engel curves differ for necessity and luxury goods.
▶️ Answer / Explanation
For necessities, the Engel curve rises slowly as income increases.
This reflects low YED (\( \mathrm{0 < YED < 1} \)).
For luxury goods, the Engel curve becomes steeper.
This reflects high YED (\( \mathrm{YED > 1} \)).
Thus, luxuries show a stronger response to income changes.
Example 2
Evaluate why an Engel curve for an inferior good may bend backward.
▶️ Answer / Explanation
At low income levels, consumers buy more of the inferior good.
As income rises, they switch to higher-quality substitutes.
This reduces demand for the inferior good.
Thus, the curve bends backward.
This reflects negative YED.