Price Elasticity of Demand (PED)
PED = Percentage change in quantity demanded ÷ Percentage change in price
Price elasticity of demand (PED) measures how responsive the quantity demanded of a good is to a change in its price.
Formula Explanation
\( \mathrm{PED = \dfrac{\%\ \Delta Q_d}{\%\ \Delta P}} \)
- \( \mathrm{\%\ \Delta Q_d} \) refers to the percentage change in quantity demanded.
- \( \mathrm{\%\ \Delta P} \) refers to the percentage change in price.
- PED shows how strongly consumers react to price changes.
Understanding the Formula
- If a small change in price causes a large change in quantity demanded → demand is elastic.
- If a large change in price causes only a small change in quantity demanded → demand is inelastic.
- PED focuses on proportional (percentage) changes, not absolute changes.
Important Note (VERY IMPORTANT)
- PED values are usually expressed as positive numbers in exams.
- This is because price and quantity demanded have an inverse relationship.
- Mathematically PED is negative, but we ignore the negative sign.
\( \mathrm{PED = \left| \dfrac{\%\ \Delta Q_d}{\%\ \Delta P} \right|} \)
Step-by-Step Calculation Idea
- Find percentage change in quantity demanded.
- Find percentage change in price.
- Divide the two values.
Key Ideas:
- PED measures sensitivity to price changes.
- It is a ratio of percentage changes.
- Used by firms to make pricing decisions.
- Forms the foundation for classifying demand.
Example 1
The price of a good increases by 10%, and quantity demanded falls by 20%. Calculate PED.
▶️ Answer / Explanation
\( \mathrm{PED = \dfrac{20}{10} = 2} \)
Demand is elastic because \( \mathrm{PED > 1} \).
Example 2
At a price \( \mathrm{P_1 = \$20} \), quantity demanded is \( \mathrm{Q_1 = 50} \) units.
At a price \( \mathrm{P_2 = \$25} \), quantity demanded is \( \mathrm{Q_2 = 40} \) units.
Calculate the price elasticity of demand (PED).
▶️ Answer / Explanation
Step 1: Calculate percentage change in price
\( \mathrm{\%\ \Delta P = \dfrac{25 – 20}{20} \times 100 = 25\%} \)
Step 2: Calculate percentage change in quantity demanded
\( \mathrm{\%\ \Delta Q_d = \dfrac{40 – 50}{50} \times 100 = -20\%} \)
Step 3: Apply PED formula
\( \mathrm{PED = \left| \dfrac{-20}{25} \right| = 0.8} \)
Conclusion:
\( \mathrm{PED = 0.8 < 1} \), so demand is relatively inelastic.
Price Elasticity of Demand (PED)
Degrees of PED — Theoretical Range of Values
The value of price elasticity of demand (PED) can take different values, indicating different degrees of responsiveness of quantity demanded to changes in price.

Full Range of PED Values
The theoretical range of PED values is:
\( \mathrm{0 \ \leq \ PED \ \leq \ \infty} \)
- PED is always taken as a positive value (absolute value).
- Different values represent different levels of responsiveness.
Degrees of PED
| Type of Demand | PED Value | Explanation |
|---|---|---|
Perfectly Inelastic | \( \mathrm{PED = 0} \) | No change in quantity demanded despite price change |
Relatively Inelastic | \( \mathrm{0 < PED < 1} \) | Small change in quantity demanded |
Unit Elastic | \( \mathrm{PED = 1} \) | Proportional change in quantity demanded |
Relatively Elastic | \( \mathrm{PED > 1} \) | Large change in quantity demanded |
Perfectly Elastic | \( \mathrm{PED = \infty} \) | Infinite response to price change |
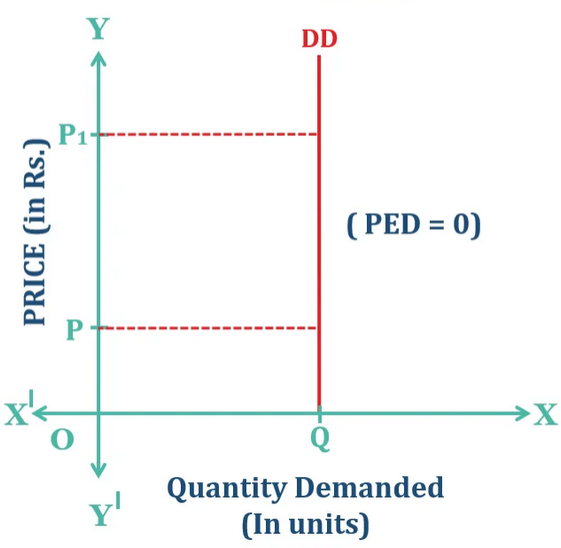
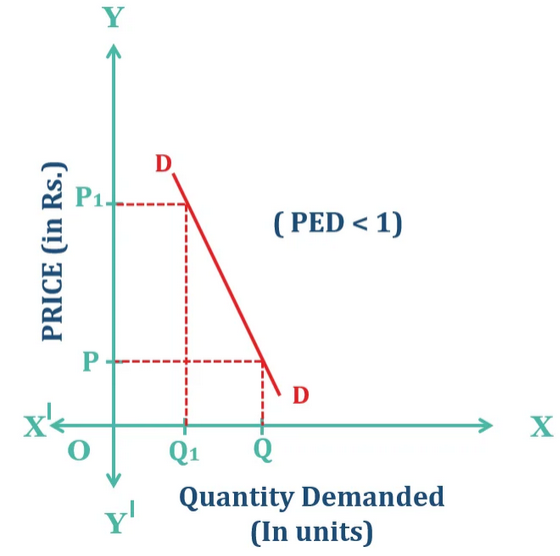
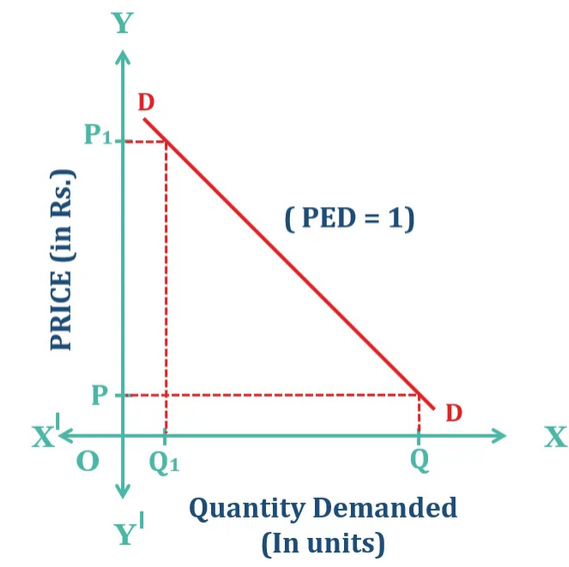
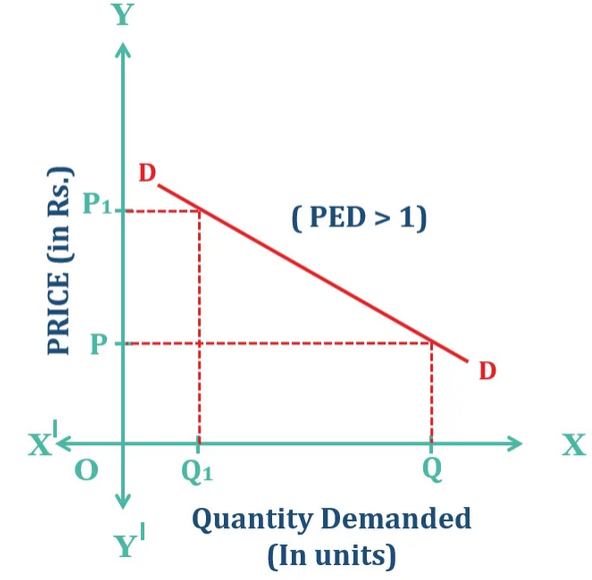
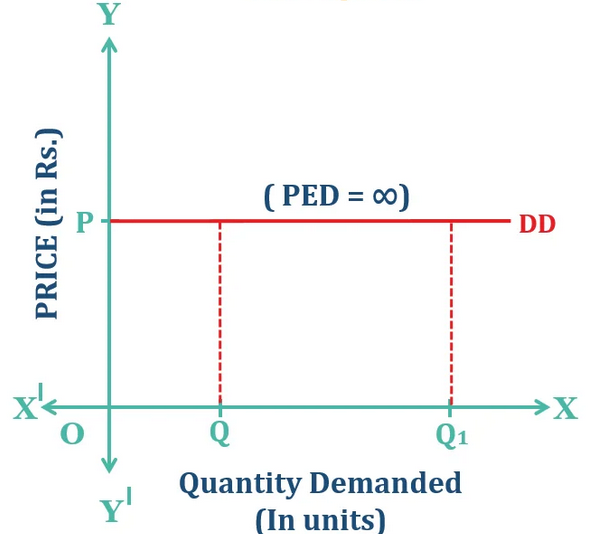
Diagram: Degrees of PED
- Perfectly inelastic → vertical demand curve
- Perfectly elastic → horizontal demand curve
- Relatively elastic → flatter curve
- Relatively inelastic → steeper curve
Economic Interpretation:
- Higher PED → consumers are more responsive to price changes.
- Lower PED → consumers are less responsive.
- Elasticity affects revenue, pricing, and business strategy.
Key Ideas:
- PED ranges from 0 to infinity.
- Different values represent different demand behaviour.
- Understanding degrees helps in predicting consumer response.
- Important for both firms and policymakers.
Example 1
A good has a PED of 0.3. Explain what this means.
▶️ Answer / Explanation
\( \mathrm{PED = 0.3 < 1} \), so demand is relatively inelastic.
This means quantity demanded changes by a smaller percentage than price.
Consumers are not very responsive to price changes.
Example 2
Evaluate the significance of perfectly inelastic demand.
▶️ Answer / Explanation
Perfectly inelastic demand means quantity demanded does not change at all when price changes.
This occurs for essential goods with no substitutes, such as life-saving medicines.
Consumers must purchase the good regardless of price.
This gives firms significant pricing power, but may raise ethical concerns.