
Economic Growth
Economic growth refers to an increase in the production of goods and services in an economy over time.
Economic growth is usually measured by the increase in real GDP or real national income.
Economic growth → Increase in real output over time
Economic growth can be divided into:
- Short-term growth
- Long-term growth
Short-Term Economic Growth
Short-term economic growth refers to an increase in actual output over a relatively short period of time.
It occurs when the economy moves closer toward its existing productive capacity.
Key Idea:
- Short-term growth uses existing resources more fully.
Actual Growth in the PPC Model
In the Production Possibilities Curve (PPC) model, short-term growth is shown as a movement from a point inside the PPC toward a point closer to or on the PPC.
This occurs because previously unemployed or underutilized resources become employed.
Meaning of Actual Growth
- The economy produces more output using existing resources.
- There is no increase in productive capacity itself.
- Only resource utilization improves.
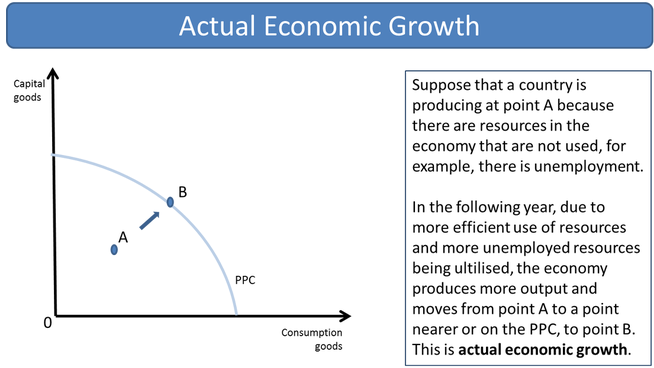
Inside PPC → Movement toward PPC = Actual growth
Causes of Actual Growth
- Increase in aggregate demand
- Lower unemployment
- Higher consumer spending
- Higher investment spending
- Expansionary fiscal or monetary policy
Example of Actual Growth
During a recession, many workers and factories may remain unused.
If aggregate demand increases:
- Firms increase production.
- More workers are hired.
- The economy moves closer to full employment output.
Role of Aggregate Demand (AD) in the AD/AS Model
In the AD/AS model, short-term economic growth is mainly caused by an increase in aggregate demand (AD).
When AD increases:
- Firms increase output to meet higher demand.
- Real GDP rises.
- Employment increases.
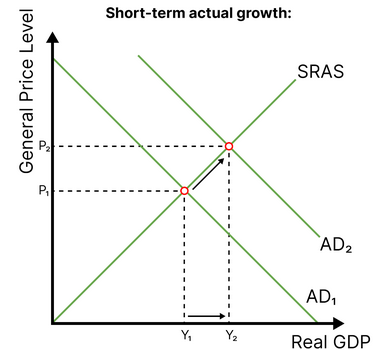
AD ↑ → Real output ↑ → Short-term growth
Sources of Increased Aggregate Demand
- Higher consumption
- Higher investment
- Higher government spending
- Higher net exports
Short-Run Effects of Increased AD
Positive Effects:
- Higher output
- Lower cyclical unemployment
- Higher income and spending
Possible Negative Effects:
- Inflationary pressure if the economy approaches full employment.
- Demand-pull inflation may occur.
Limitations of Short-Term Growth
- Does not increase productive capacity.
- Cannot continue indefinitely once full employment is reached.
- May create inflation if AD grows too rapidly.
Importance of Short-Term Growth
- Reduces cyclical unemployment.
- Increases income and living standards temporarily.
- Improves business confidence.
- Supports economic recovery during recessions.
Key Ideas:
- Short-term growth means an increase in actual output.
- In the PPC model, it is shown by movement toward the PPC.
- In the AD/AS model, it is mainly caused by higher aggregate demand.
- Short-term growth uses existing resources more fully.
Example 1
Explain how an increase in aggregate demand may create short-term economic growth.
▶️ Answer / Explanation
If aggregate demand increases, firms experience higher demand for goods and services.
Firms increase production and hire more workers.
Real GDP rises and unemployment falls.
This creates short-term economic growth.
Example 2
Using the PPC model, explain actual economic growth.
▶️ Answer / Explanation
If an economy is operating inside its PPC, some resources are unemployed.
When more resources become employed, production increases.
The economy moves from a point inside the PPC toward the curve.
This movement represents actual short-term economic growth.
Long-Term Economic Growth
Long-term economic growth refers to an increase in the economy’s productive capacity over time.
It occurs when the economy becomes capable of producing more goods and services than before.
Long-term growth → Increase in potential output
Unlike short-term growth, long-term growth is sustainable because it results from increases in resources, productivity, and efficiency.
Characteristics of Long-Term Growth
- Increases the economy’s potential output.
- Allows higher real GDP without inflationary pressure.
- Improves living standards over time.
- Represents expansion of productive capacity.
Shifts of the PPC (Growth in Production Possibilities)
In the Production Possibilities Curve (PPC) model, long-term economic growth is shown by an outward shift of the PPC.
This means the economy can produce more combinations of goods and services than before.
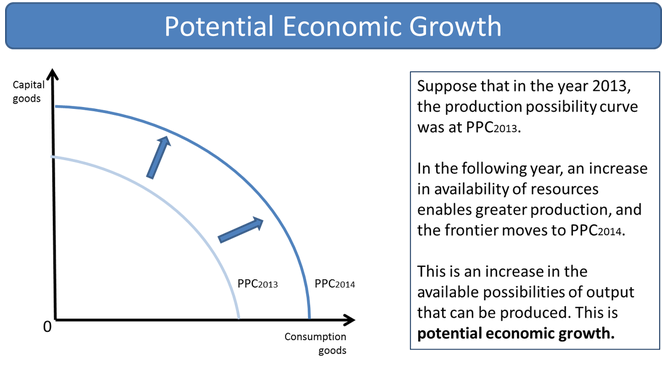
Outward shift of PPC = Growth in production possibilities
Meaning of an Outward Shift of the PPC
- The economy’s productive capacity has increased.
- More resources or better-quality resources are available.
- Productivity and efficiency improve.
Key Insight:
- The economy can now produce more consumer goods and capital goods.
Causes of Long-Term Growth in the PPC Model
1. Increase in Quantity of Factors of Production
- Growth in labour force
- Increase in capital stock
- Discovery of natural resources
2. Improvement in Quality of Factors of Production
- Better education and training
- Improved health of workers
- Higher-quality machinery
3. Technological Progress
- Automation
- Artificial intelligence
- Improved production methods
4. Increased Efficiency
- Better management
- Specialization and division of labour
- Improved infrastructure
5. Institutional Improvements
- Stable legal systems
- Reduced corruption
- Efficient financial systems
Role of LRAS in the AD/AS Model
In the AD/AS model, long-term economic growth is shown by a rightward shift of the LRAS curve.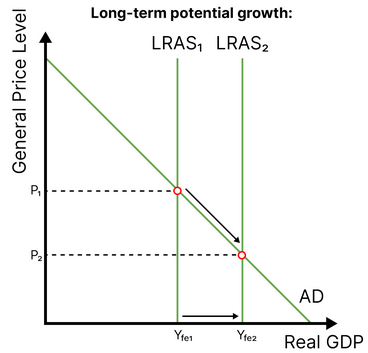
The LRAS curve represents the economy’s potential output.
LRAS shifts right → Potential output increases
Meaning of a Rightward Shift of LRAS
- The economy can produce more output at full employment.
- Productive capacity has expanded.
- Sustainable economic growth occurs.
Relationship Between PPC and LRAS
Both models represent the same idea:
- Outward shift of PPC = Increase in productive capacity
- Rightward shift of LRAS = Increase in potential output
Both indicate long-term economic growth.
Effects of Long-Term Economic Growth
Positive Effects:
- Higher living standards
- Lower unemployment
- Higher incomes
- Greater government tax revenue
- Improved public services
Possible Negative Effects:
- Environmental damage
- Resource depletion
- Income inequality
- Urban congestion and pollution
Importance of Capital Goods
Investment in capital goods is especially important for long-term growth.
- Producing more capital goods today increases future productive capacity.
- Investment supports future economic growth.
Key Trade-Off:
- Producing more capital goods may require sacrificing some current consumer goods.
Comparison Between Short-Term and Long-Term Growth
| Aspect | Short-Term Growth | Long-Term Growth |
|---|---|---|
| Main Cause | Increase in AD | Increase in productive capacity |
| PPC Representation | Movement toward PPC | Outward shift of PPC |
| AD/AS Representation | Movement along SRAS | Rightward shift of LRAS |
| Sustainability | Temporary | Sustainable |
Importance of Long-Term Growth
- Improves economic well-being.
- Raises productive capacity sustainably.
- Supports future living standards.
- Allows economic development over time.
Key Ideas:
- Long-term growth increases productive capacity and potential output.
- In the PPC model, it is shown by an outward shift of the PPC.
- In the AD/AS model, it is shown by a rightward shift of LRAS.
- Technology, efficiency, and better resources are major causes of long-term growth.
Example 1
Explain how investment in education may lead to long-term economic growth.
▶️ Answer / Explanation
Education improves the quality and productivity of labour.
Workers become more skilled and efficient.
Firms can produce more output using the same resources.
This increases potential output and shifts the LRAS curve to the right.
Example 2
Using the PPC model, explain long-term economic growth.
▶️ Answer / Explanation
If the economy experiences technological progress or investment in capital goods, productive capacity increases.
The PPC shifts outward because the economy can now produce more goods and services.
This outward shift represents long-term economic growth.
Measurement of Economic Growth
Economic growth is measured by the increase in the economy’s real output over time.
The most common measure of economic growth is the increase in:
- Real Gross Domestic Product (real GDP)
- Real Gross National Income (real GNI)
Economists use real measures because they remove the effects of inflation and reflect actual changes in output.
Economic growth = Increase in real GDP or real GNI over time
Real GDP as a Measure of Economic Growth
Real GDP measures the inflation-adjusted value of goods and services produced within a country during a given period of time.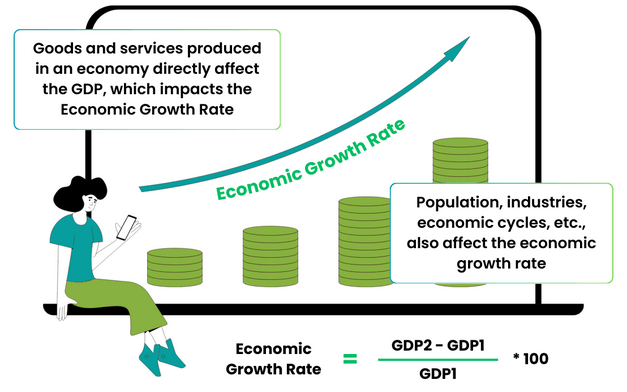
When real GDP increases:
- The economy is producing more output.
- Economic activity is increasing.
- Economic growth is occurring.
Economic Growth Rate
The economic growth rate measures the percentage change in real GDP from one period to another.
\( \mathrm{Economic\ Growth\ Rate = \dfrac{Real\ GDP_{new} – Real\ GDP_{old}}{Real\ GDP_{old}} \times 100} \)
Meaning:
- A positive growth rate means the economy is expanding.
- A negative growth rate means the economy is contracting.
Example of Economic Growth Calculation
If real GDP increases from \( \mathrm{500\ billion} \) to \( \mathrm{525\ billion} \):
\( \mathrm{Growth\ Rate = \dfrac{525 – 500}{500} \times 100 = 5\%} \)
This means the economy grew by \( \mathrm{5\%} \).
Real GDP Per Capita
Real GDP per capita measures average real output per person.
It is often considered a better indicator of changes in living standards than total GDP.
\( \mathrm{Real\ GDP\ per\ capita = \dfrac{Real\ GDP}{Population}} \)
Why Real GDP Per Capita Is Important
- Population growth may reduce gains in living standards.
- Total GDP may rise even if average income per person does not improve.
- Per capita measures provide a clearer view of average economic well-being.
Real GNI as a Measure of Economic Growth
Real GNI measures the inflation-adjusted income earned by residents of a country.
It includes:
- Income earned domestically
- Income earned abroad by residents
- Excludes income earned domestically by foreigners
Importance:
- May better reflect income available to residents.
- Useful for countries with large foreign investment flows.
Short-Term vs Long-Term Economic Growth Measurement
Short-Term Growth:
- Measured by increases in actual real GDP.
- Reflects increased use of existing resources.
Long-Term Growth:
- Measured by increases in potential output.
- Reflects increases in productive capacity.
Importance of Measuring Economic Growth
- Helps governments evaluate economic performance.
- Used for policy making and planning.
- Shows changes in living standards and employment.
- Important for international comparisons.
Limitations of Measuring Economic Growth Using GDP/GNI
Although useful, GDP and GNI have limitations as measures of economic growth and well-being.
1. Informal Economy Excluded
- Unrecorded economic activities may not be included.
- Economic growth may be underestimated.
2. Non-Market Activities Excluded
- Household work and volunteer services are not counted.
3. Does Not Measure Income Distribution
- GDP may rise while inequality worsens.
- Benefits of growth may not be shared equally.
4. Environmental Costs Ignored
- Economic growth may create pollution and resource depletion.
- GDP does not account for environmental damage.
5. Quality of Life Not Fully Measured
- GDP does not directly measure happiness, health, or education quality.
Nominal vs Real Measures
| Measure | Meaning |
|---|---|
| Nominal GDP | Measured at current prices |
| Real GDP | Adjusted for inflation |
| Real GDP per capita | Real output per person |
| Real GNI | Inflation-adjusted national income |
Summary Table
| Measure | Purpose |
|---|---|
| Real GDP | Measures domestic output growth |
| Growth Rate | Measures percentage increase in output |
| Real GDP per capita | Measures average living standards |
| Real GNI | Measures income earned by residents |
Key Ideas:
- Economic growth is usually measured using real GDP or real GNI.
- Real measures remove the effects of inflation.
- Real GDP per capita is useful for measuring average living standards.
- GDP and GNI have limitations as measures of well-being.
Example 1
Calculate the economic growth rate if real GDP increases from \( \mathrm{800\ billion} \) to \( \mathrm{840\ billion} \).
▶️ Answer / Explanation
\( \mathrm{Growth\ Rate = \dfrac{840 – 800}{800} \times 100} \)
\( \mathrm{= \dfrac{40}{800} \times 100 = 5\%} \)
The economy experienced \( \mathrm{5\%} \) economic growth.
Example 2
Explain why real GDP per capita is often a better measure of living standards than total GDP.
▶️ Answer / Explanation
Total GDP may increase because of population growth.
However, if population rises faster than GDP, average income per person may fall.
Real GDP per capita adjusts for population size and better reflects average living standards.