
Low and Stable Rate of Inflation
Inflation refers to a sustained increase in the general price level over time.
A low and stable rate of inflation is an important macroeconomic objective because it helps maintain economic stability and confidence.
Very high or unstable inflation can create uncertainty and economic problems.
Inflation → General increase in prices over time
A low and stable inflation rate:
- Supports economic growth
- Encourages investment and saving
- Maintains purchasing power more effectively
- Reduces uncertainty in the economy
Measuring the Inflation Rate Using Consumer Price Index (CPI) Data
The Consumer Price Index (CPI) is the most common measure of inflation.
The CPI measures the average change in prices of a basket of goods and services consumed by households over time.
Meaning of the CPI Basket
The CPI basket includes representative goods and services such as: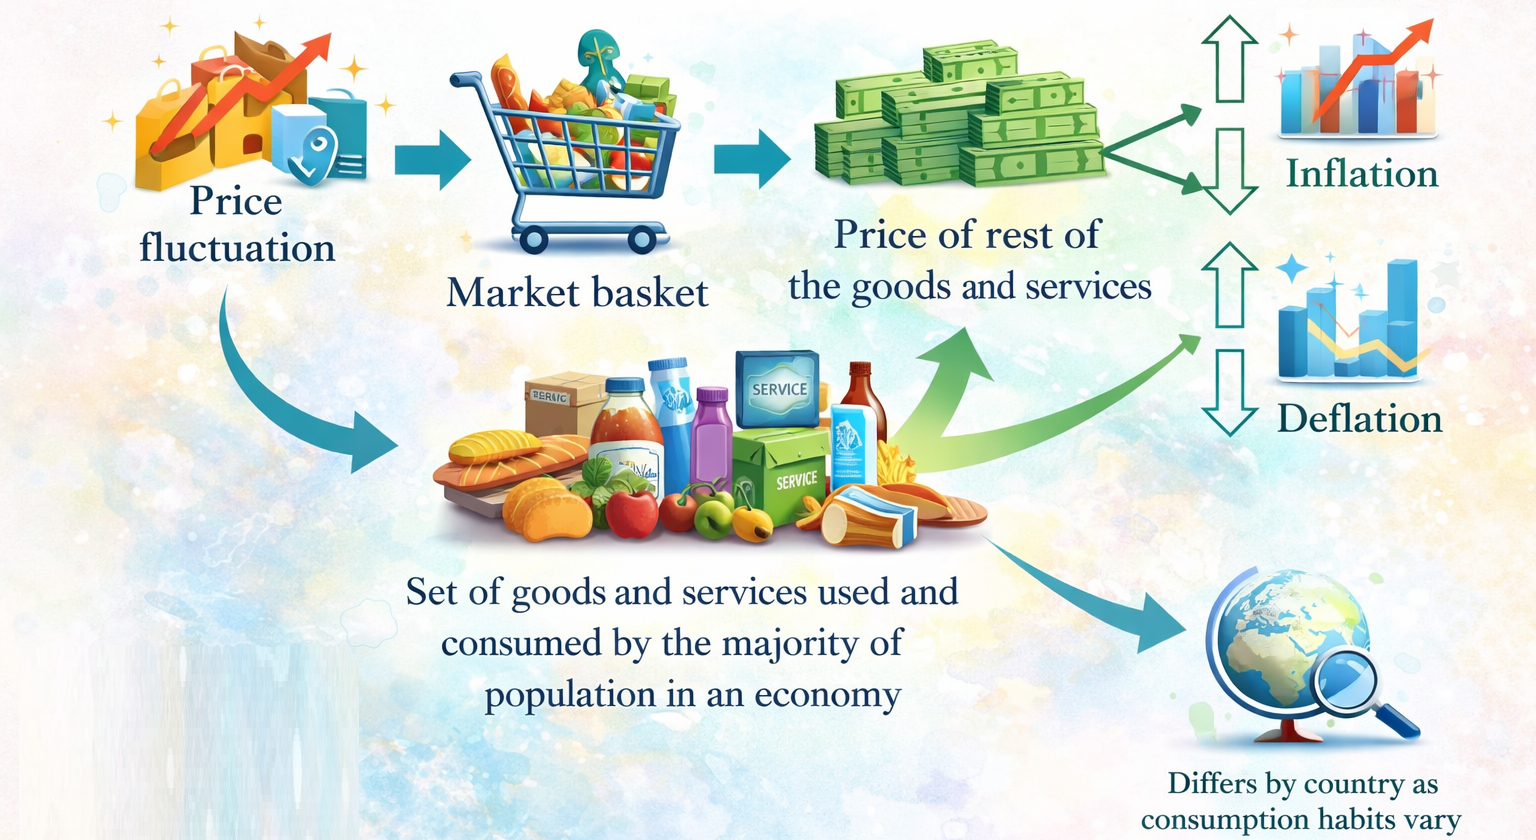
- Food and beverages
- Housing
- Transportation
- Healthcare
- Education
- Clothing
- Entertainment
The basket is weighted according to typical household spending patterns.
Calculation of the Inflation Rate
The inflation rate measures the percentage change in the CPI between two time periods.
\( \mathrm{Inflation\ Rate = \dfrac{CPI_{new} – CPI_{old}}{CPI_{old}} \times 100} \)
Example of Inflation Rate Calculation
If:
- \( \mathrm{CPI_{old} = 120} \)
- \( \mathrm{CPI_{new} = 126} \)
Then:
\( \mathrm{Inflation\ Rate = \dfrac{126 – 120}{120} \times 100} \)
\( \mathrm{= \dfrac{6}{120} \times 100 = 5\%} \)
The inflation rate is \( \mathrm{5\%} \).
Importance of CPI
- Measures changes in cost of living.
- Used by governments and central banks for policy decisions.
- Helps adjust wages, pensions, and benefits.
- Important for comparing inflation over time.
Limitations of the CPI in Measuring Inflation
Although CPI is widely used, it has several limitations.
1. Changes in Consumer Spending Patterns
- Consumers may substitute cheaper goods when prices rise.
- The fixed basket may not reflect changing consumption patterns accurately.
2. Quality Changes
- Improved product quality may increase prices.
- Higher prices may partly reflect better products rather than inflation.
3. New Products
- New goods and services may not immediately enter the CPI basket.
- The CPI may not fully reflect current consumer behaviour.
4. Different Inflation Rates for Different Groups
- Different households spend income differently.
- Inflation experienced by elderly or low-income households may differ from average CPI inflation.
5. Informal Economy Excluded
- Prices in informal markets may not be included.
6. Regional Differences
- Prices may vary significantly across regions.
- A national CPI may not represent local price changes accurately.
Causes of Inflation
The two main causes of inflation are:
- Demand-pull inflation
- Cost-push inflation
1. Demand-Pull Inflation
Demand-pull inflation occurs when aggregate demand increases faster than the economy’s productive capacity.
AD ↑ faster than AS → Inflation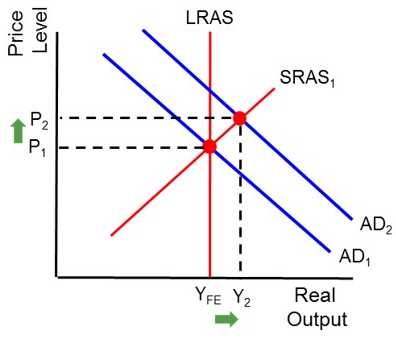
Causes of Demand-Pull Inflation
- Higher consumer spending
- Higher investment
- Higher government spending
- Increase in exports
- Expansionary monetary policy
Effects of Demand-Pull Inflation
- Prices rise because demand exceeds supply.
- Often occurs during economic booms.
- May create inflationary gaps.
2. Cost-Push Inflation
Cost-push inflation occurs when rising production costs reduce aggregate supply.
Production costs ↑ → SRAS shifts left → Inflation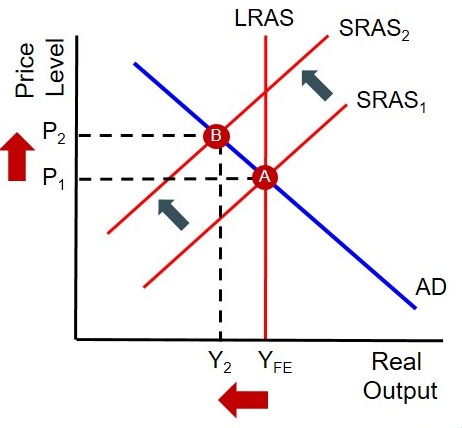
Causes of Cost-Push Inflation
- Higher wages
- Higher oil and energy prices
- Higher raw material costs
- Indirect taxes
- Currency depreciation increasing import costs
Effects of Cost-Push Inflation
- Prices rise while output may fall.
- Unemployment may increase.
- Can create stagflation.
Costs of a High Inflation Rate
High inflation creates several economic and social problems.
1. Uncertainty
- Businesses and consumers may find future prices difficult to predict.
- Investment decisions become more risky.
- Economic confidence may decrease.
2. Redistributive Effects
- Some groups gain while others lose.
- People on fixed incomes lose purchasing power.
- Borrowers may benefit while lenders lose.
3. Effects on Saving
- High inflation reduces the real value of savings.
- People may become discouraged from saving.
4. Damage to Export Competitiveness
- Domestic goods become relatively more expensive internationally.
- Exports may decrease.
- Imports may increase.
5. Impact on Economic Growth
- Uncertainty and reduced investment may slow growth.
- High inflation may destabilize the economy.
6. Inefficient Resource Allocation
- Rapid price changes distort price signals.
- Firms and consumers may make inefficient decisions.
Comparison Between Demand-Pull and Cost-Push Inflation
| Aspect | Demand-Pull Inflation | Cost-Push Inflation |
|---|---|---|
| Main Cause | Increase in aggregate demand | Increase in production costs |
| AD/AS Effect | AD shifts right | SRAS shifts left |
| Economic Condition | Usually during booms | Can occur during slow growth |
| Effect on Output | Output may rise initially | Output may fall |
Importance of Low and Stable Inflation
- Encourages investment and economic confidence.
- Supports stable economic growth.
- Protects purchasing power more effectively.
- Improves long-term planning for households and firms.
Key Ideas:
- Inflation is measured using the CPI.
- CPI has limitations because spending patterns and product quality change.
- Demand-pull inflation results from excessive aggregate demand.
- Cost-push inflation results from rising production costs.
- High inflation creates uncertainty and economic inefficiency.
Example 1
Calculate the inflation rate if the CPI rises from \( \mathrm{140} \) to \( \mathrm{147} \).
▶️ Answer / Explanation
\( \mathrm{Inflation\ Rate = \dfrac{147 – 140}{140} \times 100} \)
\( \mathrm{= \dfrac{7}{140} \times 100 = 5\%} \)
The inflation rate is \( \mathrm{5\%} \).
Example 2
Using an example, explain cost-push inflation.
▶️ Answer / Explanation
If oil prices increase sharply, transportation and production costs rise for many firms.
Firms increase prices to maintain profits.
Aggregate supply decreases and the general price level rises.
This is cost-push inflation.
Example 3: Calculation of a Weighted Price Index (HL Only)
The following data shows prices and weights for three goods.
| Good | Base Year Price | Current Year Price | Weight |
|---|---|---|---|
| Food | \( \mathrm{20} \) | \( \mathrm{25} \) | \( \mathrm{40} \) |
| Transport | \( \mathrm{10} \) | \( \mathrm{12} \) | \( \mathrm{35} \) |
| Clothing | \( \mathrm{15} \) | \( \mathrm{18} \) | \( \mathrm{25} \) |
Calculate the weighted price index.
▶️ Answer / Explanation
Step 1: Calculate price relatives
\( \mathrm{Food = \dfrac{25}{20} \times 100 = 125} \)
\( \mathrm{Transport = \dfrac{12}{10} \times 100 = 120} \)
\( \mathrm{Clothing = \dfrac{18}{15} \times 100 = 120} \)
Step 2: Multiply by weights
\( \mathrm{Food = 125 \times 40 = 5000} \)
\( \mathrm{Transport = 120 \times 35 = 4200} \)
\( \mathrm{Clothing = 120 \times 25 = 3000} \)
Step 3: Add weighted values
\( \mathrm{5000 + 4200 + 3000 = 12200} \)
Step 4: Divide by total weights
\( \mathrm{Weighted\ Price\ Index = \dfrac{12200}{100}} \)
\( \mathrm{= 122} \)
Final Answer:
The weighted price index is \( \mathrm{122} \).
Example 4: Calculation of Inflation Rate Using Quantities Purchased as Weights in the CPI
The following data shows prices and quantities purchased for a consumer basket.
| Good | Base Year Price | Current Year Price | Quantity Purchased |
|---|---|---|---|
| Rice | \( \mathrm{5} \) | \( \mathrm{6} \) | \( \mathrm{50} \) |
| Milk | \( \mathrm{4} \) | \( \mathrm{5} \) | \( \mathrm{30} \) |
| Bread | \( \mathrm{2} \) | \( \mathrm{3} \) | \( \mathrm{20} \) |
Calculate the inflation rate using quantities purchased as weights.
▶️ Answer / Explanation
Step 1: Calculate base year basket cost
\( \mathrm{Rice = 5 \times 50 = 250} \)
\( \mathrm{Milk = 4 \times 30 = 120} \)
\( \mathrm{Bread = 2 \times 20 = 40} \)
\( \mathrm{Total\ Base\ Year\ Cost = 250 + 120 + 40 = 410} \)
Step 2: Calculate current year basket cost
\( \mathrm{Rice = 6 \times 50 = 300} \)
\( \mathrm{Milk = 5 \times 30 = 150} \)
\( \mathrm{Bread = 3 \times 20 = 60} \)
\( \mathrm{Total\ Current\ Year\ Cost = 300 + 150 + 60 = 510} \)
Step 3: Calculate CPI
\( \mathrm{CPI = \dfrac{510}{410} \times 100} \)
\( \mathrm{= 124.39} \)
Step 4: Calculate inflation rate
Assuming the base year CPI is \( \mathrm{100} \):
\( \mathrm{Inflation\ Rate = \dfrac{124.39 – 100}{100} \times 100} \)
\( \mathrm{= 24.39\%} \)
Final Answer:
The inflation rate is approximately \( \mathrm{24.39\%} \).
Deflation
Deflation refers to a sustained decrease in the general price level over time.
During deflation, the average prices of goods and services fall continuously.
Deflation → General price level decreases over time
Although lower prices may appear beneficial, persistent deflation can create serious economic problems.
Causes of Deflation
Deflation mainly occurs because of:
- Decreases in aggregate demand (AD)
- Increases in short-run aggregate supply (SRAS)
1. Deflation Caused by a Fall in Aggregate Demand (AD)
Deflation commonly occurs when aggregate demand decreases significantly.
When households, firms, or governments reduce spending: 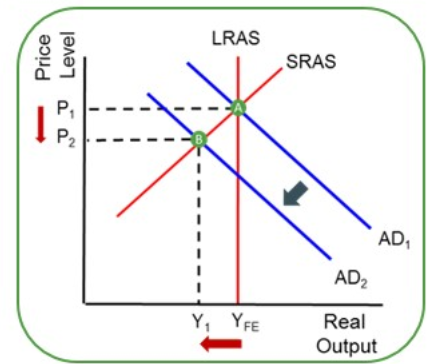
- Demand for goods and services falls.
- Firms reduce prices to encourage sales.
- The general price level decreases.
AD ↓ → Price level ↓ → Deflation
Causes of Falling AD
- Lower consumer confidence
- Reduced investment spending
- Higher interest rates
- Lower government spending
- Higher taxes
- Falling exports
Example of Demand-Side Deflation
During a severe recession:
- Consumers reduce spending.
- Firms experience weak demand.
- Prices begin to fall across the economy.
2. Deflation Caused by an Increase in SRAS
Deflation may also occur when aggregate supply increases faster than aggregate demand.
If production costs fall or productivity rises: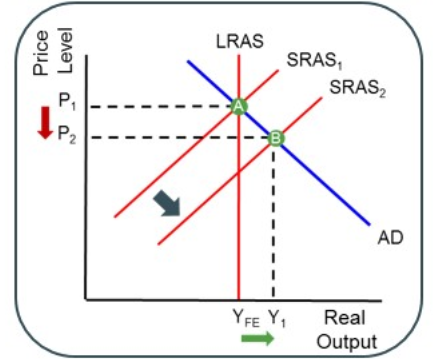
- Firms can produce more at lower costs.
- Prices may decrease.
SRAS ↑ → Price level ↓
Causes of Rising SRAS
- Technological improvements
- Lower wages
- Lower raw material prices
- Lower indirect taxes
- Higher productivity
Difference Between Good and Harmful Deflation
- Deflation caused by productivity improvements may be less harmful.
- Deflation caused by falling aggregate demand is usually more dangerous because it is associated with recession and unemployment.
Disinflation and Deflation
Disinflation and deflation are different concepts.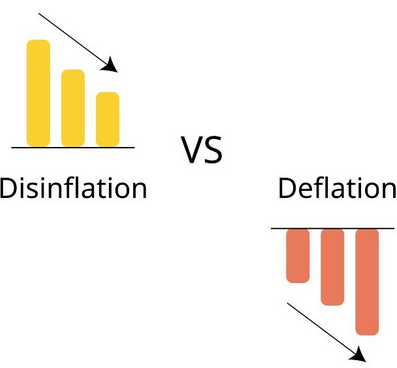
Meaning of Disinflation
Disinflation refers to a decrease in the rate of inflation.
Prices are still rising, but at a slower rate.
Example:
- Inflation falls from \( \mathrm{8\%} \) to \( \mathrm{4\%} \).
Prices continue increasing, but more slowly.
Meaning of Deflation
Deflation occurs when the inflation rate becomes negative.
Example:
- Inflation falls from \( \mathrm{2\%} \) to \( \mathrm{-3\%} \).
Prices are now decreasing overall.
Key Difference
| Concept | Meaning |
|---|---|
| Disinflation | Inflation rate falls but remains positive |
| Deflation | General price level falls |
Costs of Deflation
Persistent deflation can create serious economic and social costs.
1. Uncertainty
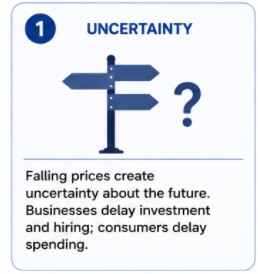
- Firms and consumers may become uncertain about future prices and profits.
- Businesses may postpone investment decisions.
- Economic confidence may weaken.
2. Redistributive Effects
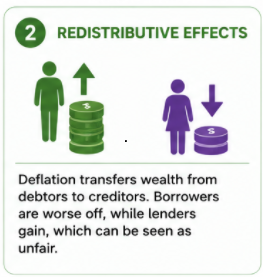
- Deflation benefits lenders because money gains purchasing power.
- Borrowers lose because debts become more expensive in real terms.
Deflation → Real value of money increases
3. Deferred Consumption
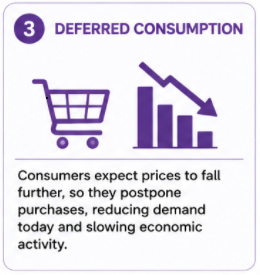
- Consumers may delay purchases expecting lower future prices.
- Demand decreases further.
- Economic activity slows down.
Example:
- Consumers postpone buying cars or electronics because prices may fall later.
4. Association with High Cyclical Unemployment and Bankruptcies
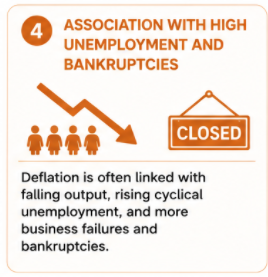
- Falling demand reduces firms’ revenues.
- Firms may reduce production and lay off workers.
- Business profits decline and bankruptcies may increase.
5. Increase in the Real Value of Debt
During deflation, the purchasing power of money rises.
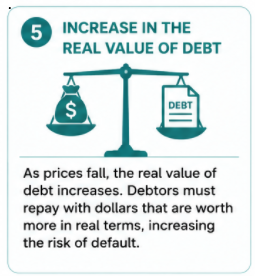
- Households and firms must repay debts using more valuable money.
- Debt burdens increase in real terms.
Effect:
- Borrowers may reduce spending further.
6. Inefficient Resource Allocation
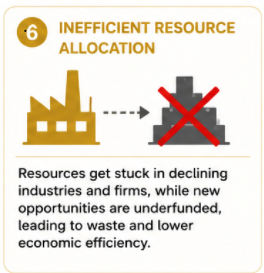
- Firms may reduce investment because of weak demand and falling profits.
- Resources may remain underutilized.
- Economic efficiency decreases.
7. Policy Ineffectiveness
Deflation may reduce the effectiveness of monetary policy.
- Interest rates may already be very low.
- Consumers and firms may still avoid borrowing and spending.
This situation is sometimes called a liquidity trap.
Deflationary Spiral
Deflation may create a vicious cycle known as a deflationary spiral.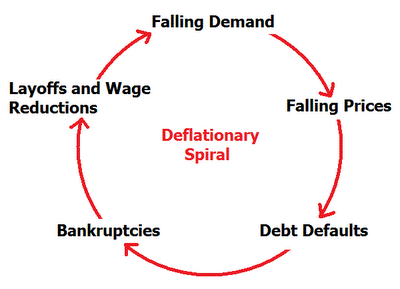
Sequence:
- Prices fall
- Consumers delay spending
- Aggregate demand decreases
- Output and employment fall
- Prices fall further
Comparison Between Inflation, Disinflation, and Deflation
| Concept | Price Movement | Inflation Rate |
|---|---|---|
| Inflation | Prices rise | Positive and increasing |
| Disinflation | Prices still rise | Positive but decreasing |
| Deflation | Prices fall | Negative |
Importance of Avoiding Deflation
- Persistent deflation may weaken economic growth.
- Can increase unemployment and bankruptcies.
- Creates long-term economic instability.
- Governments and central banks often aim for low positive inflation instead of deflation.
Key Ideas:
- Deflation is a sustained fall in the general price level.
- It may result from falling AD or rising SRAS.
- Disinflation means slower inflation, not falling prices.
- Deflation may create unemployment, debt burdens, and weak economic growth.
Example 1
Explain how a fall in aggregate demand may cause deflation.
▶️ Answer / Explanation
If consumers and firms reduce spending, aggregate demand decreases.
Firms experience lower sales and may reduce prices to encourage demand.
The general price level falls across the economy.
This creates demand-side deflation.
Example 2
Using an example, explain why deflation may increase the real value of debt.
▶️ Answer / Explanation
If prices and incomes fall during deflation, borrowers may earn less income.
However, the amount of debt they must repay remains unchanged.
Because money has greater purchasing power, debt becomes more expensive in real terms.
This increases the real burden of debt.