
Shifts of the Short-Run Aggregate Supply (SRAS) Curve
A shift of the short-run aggregate supply (SRAS) curve occurs when there is a change in the conditions of production that affects the quantity of goods and services firms are willing and able to supply at every price level.
Unlike movements along the SRAS curve, which are caused by changes in the general price level, shifts of the SRAS curve are caused by changes in production costs and other supply-side factors.
Change in production conditions → Entire SRAS curve shifts
Increase in SRAS
An increase in SRAS means firms are willing to produce more output at every price level.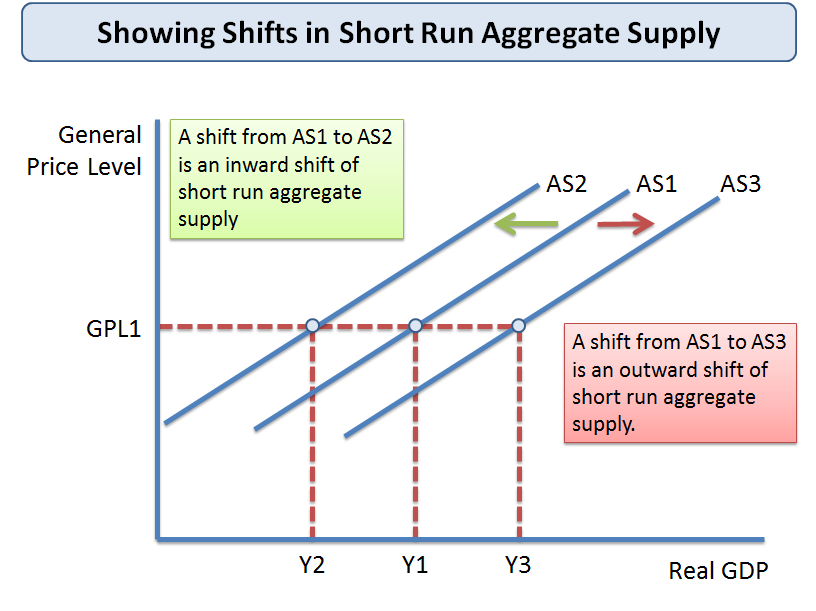
- The SRAS curve shifts to the right.
- Usually leads to higher output and lower inflationary pressure.
SRAS increase → Rightward shift
Decrease in SRAS
A decrease in SRAS means firms are willing to produce less output at every price level.
- The SRAS curve shifts to the left.
- Usually leads to lower output and higher inflationary pressure.
SRAS decrease → Leftward shift
Main Causes of Shifts in the SRAS Curve
The SRAS curve shifts mainly because of changes in:
- Costs of factors of production
- Indirect taxes and subsidies
- Productivity
- Supply shocks
1. Changes in Costs of Factors of Production
Factors of production include labour, land, capital, and entrepreneurship.
Changes in their costs directly affect firms’ production expenses.
Increase in Factor Costs
- Higher wages increase labour costs.
- Higher raw material prices increase production expenses.
- Higher energy costs raise business costs.
Effect on SRAS:
- Production becomes less profitable.
- Firms reduce output at every price level.
- The SRAS curve shifts left.
Factor costs ↑ → SRAS shifts left
Decrease in Factor Costs
- Lower wages reduce labour costs.
- Cheaper raw materials lower production expenses.
- Lower energy prices reduce operating costs.
Effect on SRAS:
- Production becomes more profitable.
- Firms increase output.
- The SRAS curve shifts right.
Factor costs ↓ → SRAS shifts right
2. Changes in Indirect Taxes and Subsidies
Indirect taxes increase firms’ production costs, while subsidies reduce costs.
Increase in Indirect Taxes
- Taxes such as sales taxes and excise duties increase business costs.
- Firms supply less output at every price level.
Effect on SRAS:
- The SRAS curve shifts left.
Indirect taxes ↑ → SRAS shifts left
Decrease in Indirect Taxes
- Production costs fall.
- Firms increase supply.
Effect on SRAS:
- The SRAS curve shifts right.
Increase in Subsidies
- Subsidies lower firms’ costs of production.
- Profitability increases.
- Firms increase output.
Subsidies ↑ → SRAS shifts right
3. Changes in Productivity
Productivity measures output produced per unit of input.
- Higher productivity lowers unit production costs.
- Firms can produce more efficiently.
Causes of Higher Productivity:
- Improved technology
- Better education and training
- Improved infrastructure
- Better management techniques
Effect on SRAS:
- SRAS shifts right.
Productivity ↑ → SRAS shifts right
4. Supply Shocks
Supply shocks are unexpected events that suddenly affect production costs or productive capacity.
Negative Supply Shocks
Examples:
- Natural disasters
- Wars
- Sharp increases in oil prices
- Pandemics
Effect:
- Production costs rise or output falls.
- SRAS shifts left.
Positive Supply Shocks
Examples:
- Technological breakthroughs
- Discovery of cheaper resources
- Improved transport systems
Effect:
- Production efficiency improves.
- SRAS shifts right.
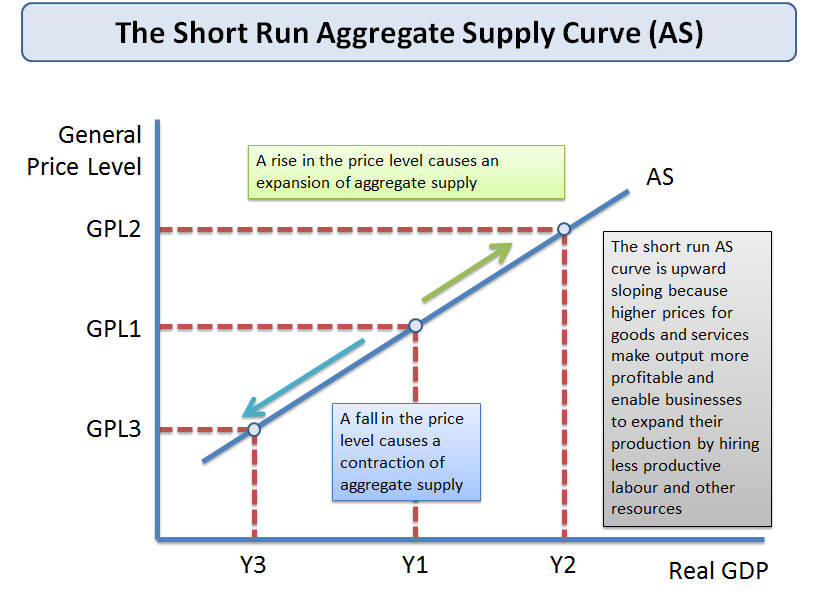
Movement Along SRAS vs Shift of SRAS
| Change | Cause | Effect |
|---|---|---|
Movement Along SRAS Curve | Change in price level | Change in quantity of output supplied |
Shift of SRAS Curve | Change in production conditions | Change in aggregate supply |
Effects of SRAS Shifts on the Economy
Rightward Shift of SRAS:
- Higher real output
- Lower unemployment
- Lower inflationary pressure
Leftward Shift of SRAS:
- Lower real output
- Higher unemployment
- Higher inflation
Summary Table of SRAS Shifts
| Change | Effect on SRAS |
|---|---|
| Wages increase | SRAS shifts left |
| Oil prices decrease | SRAS shifts right |
| Indirect taxes increase | SRAS shifts left |
| Subsidies increase | SRAS shifts right |
| Productivity increases | SRAS shifts right |
Key Ideas:
- Shifts in SRAS occur because of changes in production costs and efficiency.
- Higher costs reduce aggregate supply.
- Lower costs and higher productivity increase aggregate supply.
- SRAS shifts strongly affect inflation and unemployment.
Example 1
Explain how an increase in wages may shift the SRAS curve.
▶️ Answer / Explanation
Higher wages increase firms’ labour costs.
Production becomes more expensive and profitability decreases.
Firms reduce the quantity of output supplied at each price level.
Therefore, the SRAS curve shifts to the left.
Example 2
Using an example, explain how improvements in technology may affect SRAS.
▶️ Answer / Explanation
Improved technology increases productivity and lowers unit production costs.
For example, automation may allow firms to produce more goods using fewer workers.
Firms become more efficient and increase output at every price level.
As a result, the SRAS curve shifts to the right.