▶️ Answer/Explanation
a. [1 mark]
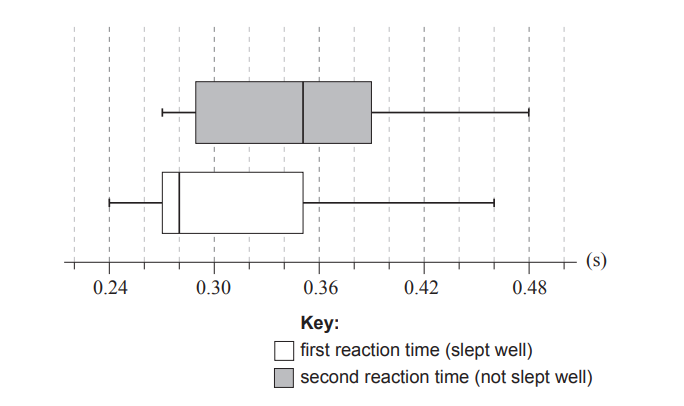
The median reaction time after sleeping well is 0.28 (s) (A1).
b. [3 marks]
IQR = 0.35 – 0.27 = 0.08 (s) (A1).
Upper fence: 0.35 + 1.5 × 0.08 = 0.35 + 0.12 = 0.47 (s) (A1).
0.46 < 0.47, so 0.46 (s) is not an outlier (R1).
c. [1 mark]
EITHER
The median is closer to the lower quartile (positively skewed) (R1).
OR
The distribution is positively skewed (R1).
OR
The range of reaction times below the median is smaller than the range of reaction times above the median (R1).
d. [1 mark]
EITHER
The distribution for ‘not sleeping well’ is centred at a higher reaction time (R1).
OR
The median reaction time after not sleeping well is equal to the upper quartile reaction time after sleeping well (R1).
OR
75% of reaction times are <0.35 seconds after sleeping well, compared with 50% after not sleeping well (R1).
OR
The sample size of 9 is too small to draw any conclusions (R1).
Markscheme Answers:
(a) 0.28 (s) (A1)
(b) IQR = 0.08 (s), upper fence = 0.47 (s), 0.46 < 0.47, so not an outlier (A1A1R1)
(c) The distribution is positively skewed (R1)
(d) The median reaction time after not sleeping well is equal to the upper quartile reaction time after sleeping well (R1)
Total [6 marks]

▶️ Answer/Explanation
a(i). [1 mark]
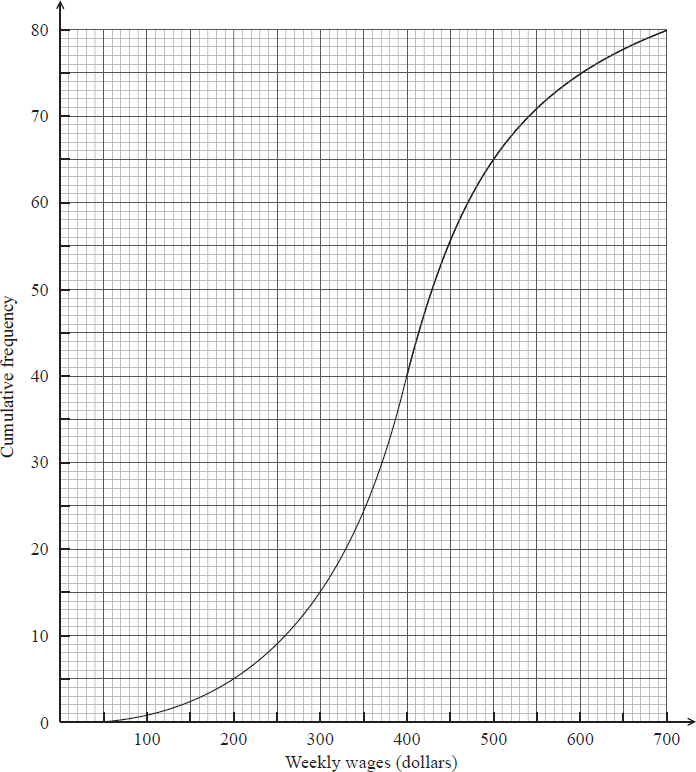
Median weekly wage = 400 (dollars) (A1).
a(ii). [3 marks]
Lower quartile = 330 (dollars) (A1).
Upper quartile = 470 (dollars) (A1).
IQR = 470 – 330 = 140 (dollars) (A1).
b(i). [1 mark]
\( a \) = 330 (dollars) (A1).
b(ii). [1 mark]
\( b \) = 400 (dollars) (A1).
b(iii). [1 mark]
\( c \) = 700 (dollars) (A1).
c. [3 marks]
Use hours = wages / rate (M1).
Substitute: \(\frac{400}{20}\) (A1).
Median hours per week = 20 (A1).
d. [5 marks]
Attempt to find wages for 25 hours per week: wages = hours × rate (M1).
Substitute: \( 25 \times 20 \) (A1).
Wages = 500 (dollars) (A1).
From cumulative frequency curve, 65 people earn 500 (dollars) or less (A1).
Number of employees who work more than 25 hours: \( 80 – 65 = 15 \) (A1).
Markscheme Answers:
a(i). 400 (dollars) (A1)
a(ii). IQR = 140 (dollars) (A1A1A1)
b(i). \( a \) = 330 (dollars) (A1)
b(ii). \( b \) = 400 (dollars) (A1)
b(iii). \( c \) = 700 (dollars) (A1)
c. 20 hours (M1A1A1)
d. 15 employees (M1A1A1A1A1)
Total [15 marks]