IB DP Math MAA SL : IB Style Mock Exams – Set 6 Paper 2

Question

A coffee shop owner believes that the number of coffees they sell on a given day is related to the average temperature of that day. The average temperature T, in degrees Celsius, on seven randomly selected days is shown in the following table. The table also shows the number of coffees, N, the coffee shop sells on those seven days.

T (0C)14.516.215.313.110.814.717.3
N (coffees)825461961128455

(a) The relationship between the variable can be modelled by the regression equation N = aT + b.

(i) Find the value of a and the value of b.

(ii) To the nearest integer, estimate the number of coffees sold on a day when the average temperature is 160C.

(b) Find the value of r, the correlation coefficient.

Answer/Explanation

Ans: 

(a) (i) a ≈ -9.93   and   b ≈ 222                     [by using G.D.C.]

(ii) Evaluating N = – 9.93 T  + 222 for T = 16, we get

N = -9.93(16) + 222

= 63.12

≈ 63 coffees

(b) r ≈ – 0.955             [by using G.D.C.]

Question

The following cumulative frequency diagram shows the distance d, in kilometres, students need to travel to get to school.

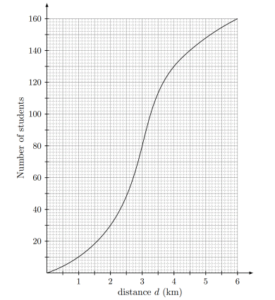
(a) Write down the median distance a student travels to school.

(b) Find the number of students who travel between 2 km and 4 km to get to school.

(c) Find the percentage of students who travel more than 4.5 km to get to school.

Answer/Explanation

Ans:

(a) median = 3 km

(b) Using the cumulative frequency diagram, we get

f(2 ≤ d ≤ 4) = 130 – 30                                 [f : frequency]

       = 100

(c) Using the cumulative frequency diagram, we have

\(P(d>4.5)=\frac{20}{160}\)

= 0.125

Hence the percentage of students who travel more than 4.5 km is 12.5%

Scroll to Top