▶️ Answer/Explanation
(a)
The associated matrix is \( \begin{pmatrix} 0 & 1 \\ -3 & -4 \end{pmatrix} \).
Find eigenvalues: \(-\lambda(-4-\lambda) + 3 = 0 \Rightarrow \lambda^2 + 4\lambda + 3 = 0 \Rightarrow \lambda = -3, -1\).
General solution: \(x(t) = A e^{-3t} + B e^{-t}\).
\(\boxed{x = A e^{-3t} + B e^{-t}}\)
(b)(i)
Initial conditions: \(x(0) = 0\) ⇒ \(A + B = 0\) ⇒ \(B = -A\).
\( \frac{dx}{dt} = -3A e^{-3t} – B e^{-t} \).
At \(t = 0\), \(\frac{dx}{dt} = -1\) ⇒ \(-3A – B = -1\) ⇒ \(-3A + A = -1\) ⇒ \(-2A = -1\) ⇒ \(A = 0.5, B = -0.5\).
Thus \(x(t) = 0.5 e^{-3t} – 0.5 e^{-t}\).
\(\boxed{x = 0.5 e^{-3t} – 0.5 e^{-t}}\)
(b)(ii)
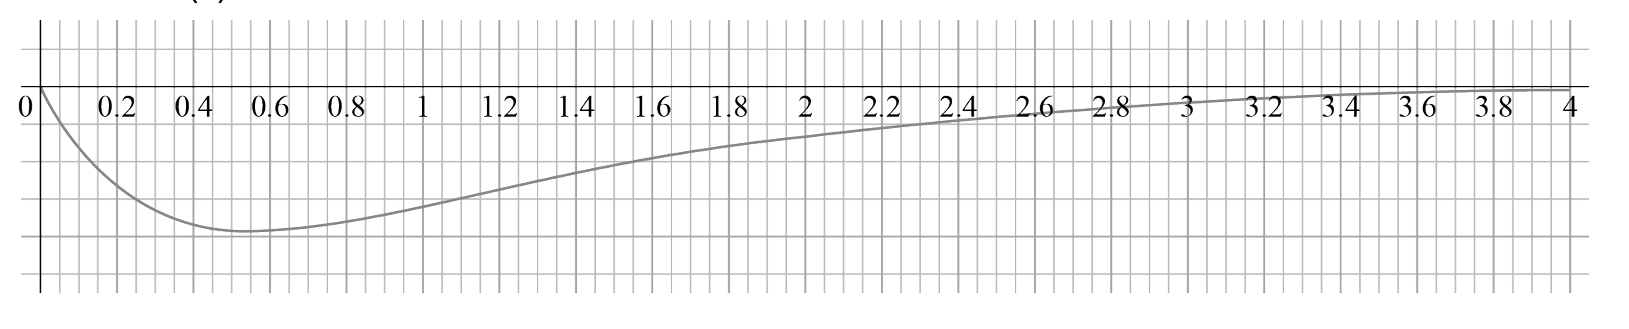
Sketch should show: starts at \(x=0\), decreases to a minimum near \(t \approx 0.55\), then increases asymptotically toward 0.
(c)(i)
The profit is maximized when \(x\) is minimized (buy low). From the graph, minimum occurs at \(t \approx 0.549\) minutes.
\(\boxed{0.549\ \text{minutes}}\)
(c)(ii)
Minimum value of \(x\) ≈ \(0.5 e^{-3(0.549)} – 0.5 e^{-0.549} \approx -0.192\).
Upper limit of profit per share ≈ \(0 – (-0.192) = 0.192\) dollars.
\(\boxed{0.192\ \text{dollars}}\)
(d)
Rewrite as coupled system:
\( \frac{dx}{dt} = y\), \( \frac{dy}{dt} = -4y – 3x + x \sin t\).
Initial: \(t_0 = 0, x_0 = 0, y_0 = -1\).
Step \(h = 0.1\):
\(x_{n+1} = x_n + 0.1 y_n\),
\(y_{n+1} = y_n + 0.1(-4y_n – 3x_n + x_n \sin t_n)\).
Iterate up to \(t = 1\) (10 steps):
After calculations, \(x_{10} \approx -0.172\).
\(\boxed{x(1) \approx -0.172}\)