Question
[Maximum mark: 16]
The table below shows the time, in minutes, taken to complete a Statistics test by a group of 100 students.
$
\begin{array}{|c|c|c|}
\hline \text { Time, } \mathbf{t}(\mathrm{min}) & \text { Frequency } & \begin{array}{c}
\text { Cumulative } \\
\text { Frequency }
\end{array} \\
\hline 10 \leq t<20 & 21 & 21 \\
\hline 20 \leq t<30 & 38 & 59 \\
\hline 30 \leq t<40 & 31 & x \\
\hline 40 \leq t<45 & 10 & 100 \\
\hline
\end{array}
$
(a) Write down the value of $x$. [2]
(b) Use the time interval midpoints to estimate the average time taken to complete the test. [3]
The time taken to complete the test is displayed on the cumulative frequency graph below.
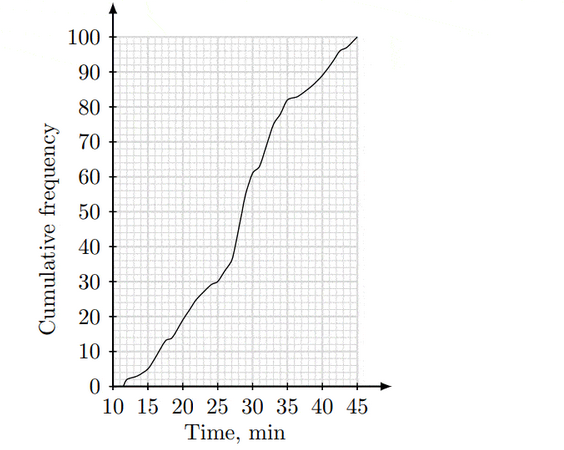
(c) Estimate the median time of test completion. [1]
(d) Estimate the number of students that spend at least 30 minutes on the test. [2]
(e) Calculate the interquartile range. [3]
(f) Draw a box-and-whisker diagram for this data. [3]
(g) Determine if a student who takes 5 minutes to complete the test would be considered an outlier. [2]
Answer/Explanation
Mark Scheme
(a) The cumulative frequency of an interval is the sum of its frequency and all the frequencies of its predecessors. We find the cumulative frequency of the interval $[30,40)$ by adding its frequency to the cumulative frequency of its preceding interval, $[20,30)$. Hence,
$
\begin{gathered}
x=59+31 \\
=90
\end{gathered}
$
(b) $\bar{x}=27.8$ minutes $\text{[by using G.D.C.]}$
(c) The median is the point at which the cumulative frequency is half of the total number of data values. There are 100 students in total. Therefore, we find the point at which the cumulative frequency is 50 . The graph shows that this is $28.5$ minutes.
Thus, median $=28.5$ minutes.
Question
[Maximum mark: 16]
50 people waiting in line at a movie cinema were asked their preference of movie genres: action $(A)$, comedy $(C)$ or drama $(D)$.
$\text{ 5 prefer all three}$
$\text{12 prefer action and comedy}$
$\text{7 prefer action and drama}$
$\text{9 prefer comedy and drama}$
$\text{8 prefer action only}$
$\text{3 prefer drama only}$
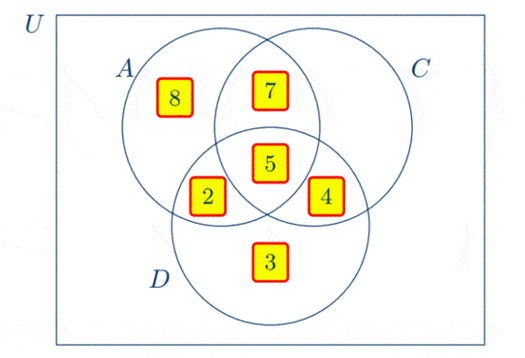
(a) Draw a Venn diagram to represent the information provided so far. [4]
(b) Write down the number of people who prefer action but not drama. [1]
There are 22 people in total who prefer comedy.
(c) (i) Calculate the number of people who prefer comedy only.
(ii) Find the number of people who prefer none of these three genres. [4]
A person is chosen at random from the 50 people that were waiting in line.
(d) Find the probability that this person
(i) prefers action;
(ii) prefers comedy and drama but not action;
(iii) does not prefer either action or comedy;
(iv) does not prefer action given that the person does not prefer comedy. [7]
Answer/Explanation
(a)
(b) The region shaded in the Venn diagram below represents those who prefer action but not drama.
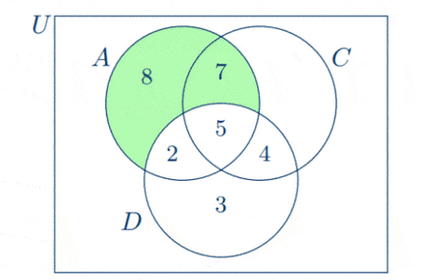
So the number of people who prefer action but not drama is
$
\begin{aligned}
n\left(A \cap D^{\prime}\right) & =8+7 \\
& =15
\end{aligned}
$