Question
[Maximum mark: 14]
125 sports fans were interviewed and asked what types of sport they have been to in the last year from a choice of soccer $(S)$, rugby $(R)$ or baseball $(B)$. The following information was obtained.
$\text{74 had been to soccer}$
$\text{36 had been to rugby}$
$\text{66 had been to baseball}$
$\text{20 had been to soccer and rugby}$
$\text{27 had been to soccer and baseball}$
$\text{24 had been to rugby and baseball}$
$\text{15 had been to all three types of sport}$
(a) Draw a Venn diagram to show the above information. [4]
(b) Find the number of sports fans who, in the last year, had been to
(i) baseball only;
(ii) both rugby and baseball but not by soccer;
(iii) at least two types of sport;
(iv) none of the three types of sport. [6]
A sports fan is selected at random from those who were interviewed.
(c) Find the probability that the sports fan had been to only one type of sport in the last year. [2]
(d) Given that the sports fan had been to only one type of sport in the last year, find the probability that the sports fan had been to rugby. [2]
Answer/Explanation
(a)

(b) (i) The region shaded in the Venn diagram below represents those who had been to baseball only.
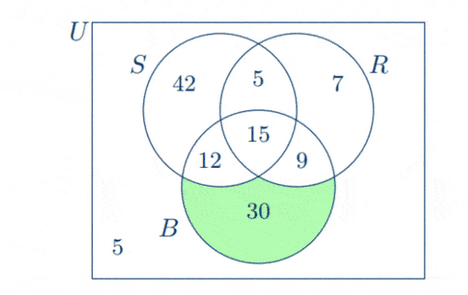
Hence the number of sports fans who had been to baseball only is
$
n\left(B \cap S^{\prime} \cap R^{\prime}\right)=30
$
Question
[Maximum mark: 16]
The following table shows the total revenue, $y$, in US dollars (USD), obtained monthly during the first six months of 2020, by Law Office of Fox Brothers and the number of clients, $x$, served.
![]()
(a) (i) Calculate the Pearson’s product-moment correlation coefficient, $r$, for this data.
(ii) Hence comment on the result. [4]
(b) Write down the equation of the regression line $y$ on $x$. [2]
(c) Use the line of the regression to estimate the revenue of serving 20 clients. Give your answer correct to the nearest USD. [3]
Monthly operating cost for the law office is $\$ 2500$. Additionally, the cost of serving each client is $\$ 200$.
(d) Determine if the law office makes a profit when serving 6 clients on a particular month. [2]
(e) (i) Write down an expression for the total revenue of serving $x$ clients.
(ii) Find an expression for the profit of the law office when serving $x$ clients on a particular month.
(iii) Find the least number of clients required to be served to result in a profit for the month. [5]
Answer/Explanation
(a) (i) $r=0.995$ $\text{[by using G.D.C.]}$
(ii) Positive, strong correlation $\mathrm{b} / \mathrm{n}$ the number of clients and revenue
(b) $y=654 x-541$ $\text{[by using G.D.C.]}$
(c) Evaluating $y=654 x-541$ for $x=20$, we get
$
\begin{aligned}
y & =654(20)-541 \\
& =12539 \\
& =12539
\end{aligned}
$
(d) The profit of the law office when serving 6 clients on a particular month is
$
\begin{aligned}
\text { Profit } & =\text { Revenue }-\text { Costs } \\
& =3000-(2500+200(6)) \\
& =-\$ 700
\end{aligned}
$
Hence the law office makes a loss when serving only 6 clients.