Question: [Maximum mark: 4]
The number of hours spent exercising each week by a group of students is shown in the following table.
| Exercising time (in hours) | Number of students |
| 2 | 5 |
| 3 | 1 |
| 4 | 4 |
| 5 | 3 |
| 6 | x |
The median is 4.5 hours.
(a) Find the value of x .
(b) Find the standard deviation.
▶️Answer/Explanation
Ans:
(a) EITHER
recognising that half the total frequency is 10 (may be seen in an ordered list or indicated on the frequency table)
OR
5 + 1 + 4 = 3 + x
OR
\(\sum f = 20\)
THEN
x = 7
(b) METHOD 1
1.58429…
1.58
METHOD 2
EITHER

Question: [Maximum mark: 7]
A survey at a swimming pool is given to one adult in each family. The age of the adult, a years old, and of their eldest child, c years old, are recorded.
The ages of the eldest child are summarized in the following box and whisker diagram.
diagram not to scale

(a) Find the largest value of c that would not be considered an outlier.
The regression line of a on c is \(a = \frac{7}{4}c + 20.\) The regression line of c on a is \(c = \frac{1}{2}a – 9.\)
(b) (i) One of the adults surveyed is 42 years old. Estimate the age of their eldest child.
(ii) Find the mean age of all the adults surveyed.
▶️Answer/Explanation
Ans:
(a) IQR = 10 – 6 (=4)
attempt to find Q3 + 1.5 × IQR
10 + 6
16
(b)
(i) choosing c = \(\frac{1}{2}a – 9\)
\(\frac{1}{2}\times 42-9\)
= 12 (years old)
(ii) attempt to solve system by substitution or elimination
34 (years old)
Question
At a skiing competition the mean time of the first three skiers is 34.1 seconds. The time for the fourth skier is then recorded and the mean time of the first four skiers is 35.0 seconds. Find the time achieved by the fourth skier.
▶️Answer/Explanation
Markscheme
total time of first 3 skiers \( = 34.1 \times 3 = 102.3\) (M1)A1
total time of first 4 skiers \( = 35.0 \times 4 = 140.0\) A1
time taken by fourth skier \( = 140.0 – 102.3 = 37.7{\text{ (seconds)}}\) A1
[4 marks]
Question
The discrete random variable X has the following probability distribution, where p is a constant.

a.Find the value of p. [2]
b.i.Find μ, the expected value of X. [2]
b.ii.Find P(X > μ). [2]
▶️Answer/Explanation
Markscheme
a.equating sum of probabilities to 1 (p + 0.5 − p + 0.25 + 0.125 + p3 = 1) M1
p3 = 0.125 = \(\frac{1}{8}\)
p= 0.5 A1
[2 marks]
μ = 0 × 0.5 + 1 × 0 + 2 × 0.25 + 3 × 0.125 + 4 × 0.125 M1
= 1.375 \(\left( { = \frac{{11}}{8}} \right)\) A1
[2 marks]
P(X > μ) = P(X = 2) + P(X = 3) + P(X = 4) (M1)
= 0.5 A1
Note: Do not award follow through A marks in (b)(i) from an incorrect value of p.
Note: Award M marks in both (b)(i) and (b)(ii) provided no negative probabilities, and provided a numerical value for μ has been found. [2 marks]
Question
Maya planted four sunflowers in order of height, from shortest to tallest.
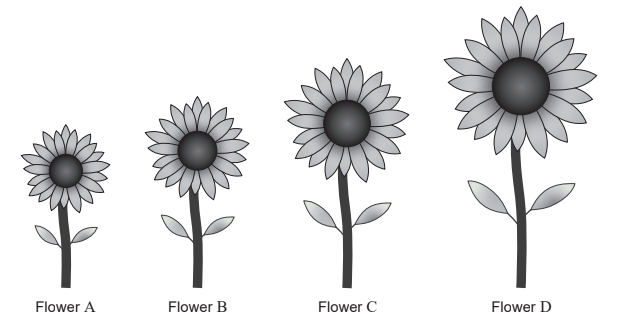
Flower C is 32 cm tall.
The median height of the flowers is 24 cm.
Find the height of Flower B. [2]
The range of the heights is 50 cm. The height of Flower A is p cm and the height of Flower D is q cm.
Using this information, write down an equation in p and q . [1]
The mean height of the flowers is 27 cm.
Write down a second equation in p and q . [1]
Using your answers to parts (b) and (c), find the height of
Flower A;
Flower D. [2]
▶️Answer/Explanation
Ans:
(a)
24-8
OR
24-(32-24)
OR
24 = \(\frac{32+h}{2}\)
16(cm)
(b) q-p= 50 (or equivalent)
(c)\(\frac{p+16+32+q}{4}\)= 27
(d)
(i) 5 (cm)
(ii) 55 (cm)
Question
A box contains 100 cards. Each card has a number between one and six written on it. The following table shows the frequencies for each number.
a.
Calculate the value of k.[2]
Find
(i) the median;
(ii) the interquartile range. [5]
▶️Answer/Explanation
Markscheme
evidence of using \(\sum {{f_i} = 100} \) (M1)
\(k = 4\) A1 N2
[2 marks]
(i) evidence of median position (M1)
e.g. 50th item, \(26 + 10 + 20 = 56\)
\({\text{median}} = 3\) A1 N2
(ii) \({Q_1} = 1\) and \({Q_3} = 5\) (A1)(A1)
\({\text{interquartile range}} = 4\) (accept 1 to 5 or \(5 – 1\) , etc.) A1 N3
[5 marks]
Question
The cumulative frequency curve below represents the marks obtained by 100 students.
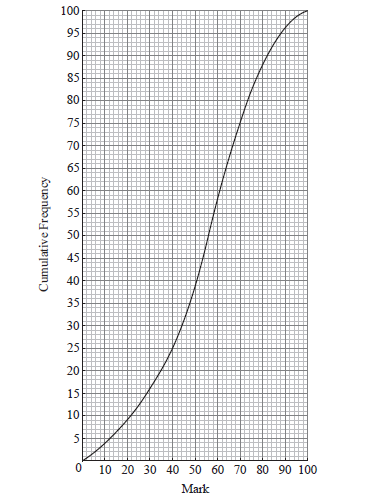
a.Find the median mark. [2]
b.Find the interquartile range. [3]
▶️Answer/Explanation
Markscheme
a.evidence of median position (M1)
e.g. 50, line on sketch
median is 56 A1 N2
[2 marks]
lower quartile \(= 40\) , upper quartile \(= 70\) (A1)(A1)
interquartile range \(= 30\) A1 N3
[3 marks]
Question
The weekly wages (in dollars) of 80 employees are displayed in the cumulative frequency curve below.
a(i) and (ii).
(i) Write down the median weekly wage.
(ii) Find the interquartile range of the weekly wages. [4]
The box-and-whisker plot below displays the weekly wages of the employees.
Write down the value of
(i) \(a\) ;
(ii) \(b\) ;
(iii) \(c\) . [3]
Employees are paid \($\ 20\) per hour.
c.Find the median number of hours worked per week.[3]
d.Employees are paid \(\$ 20\) per hour.
Find the number of employees who work more than \(25\) hours per week. [5]
▶️Answer/Explanation
Markscheme
a(i) and (ii).
(i) median weekly wage \(= 400\) (dollars) A1 N1
(ii) lower quartile \(= 330\), upper quartile \(= 470\) (A1)(A1)
\({\text{IQR}} = 140\) (dollars) (accept any notation suggesting interval \(330\) to \(470\)) A1 N3
Note: Exception to the FT rule. Award A1(FT) for an incorrect IQR only if both quartiles are explicitly noted.
[4 marks]
(i) \(330\) (dollars) A1 N1
(ii) \(400\) (dollars) A1 N1
(iii) \(700\) (dollars) A1 N1
[3 marks]
valid approach (M1)
e.g. \({\rm{hours = }}\frac{{{\rm{wages}}}}{{{\rm{rate}}}}\)
correct substitution (A1)
e.g. \(\frac{{400}}{{20}}\)
median hours per week \(= 20\) A1 N2
[3 marks]
attempt to find wages for 25 hours per week (M1)
e.g. \({\text{wages}} = {\text{hours}} \times {\text{rate}}\)
correct substitution (A1)
e.g. \(25 \times 20\)
finding wages \(= 500\) (A1)
65 people (earn 500\( \leqslant \)) (A1)
15 people (work more than 25 hours) A1 N3
[5 marks]
Question
A school collects cans for recycling to raise money. Sam’s class has 20 students.
The number of cans collected by each student in Sam’s class is shown in the following stem and leaf diagram.

The following box-and-whisker plot also displays the number of cans collected by students in Sam’s class.

There are 80 students in the school.
The mean number of cans collected is 39.4. The standard deviation is 18.5.
Each student then collects 2 more cans.
a.Find the median number of cans collected.[2]
b.(i) Write down the value of \(a\).
(ii) The interquartile range is 14. Find the value of \(b\).[3]
Sam’s class collected 745 cans. They want an average of 40 cans per student.
c.How many more cans need to be collected to achieve this target?[3]
The students raise $0.10 for each recycled can.
d.
(i) Find the largest amount raised by a student in Sam’s class.
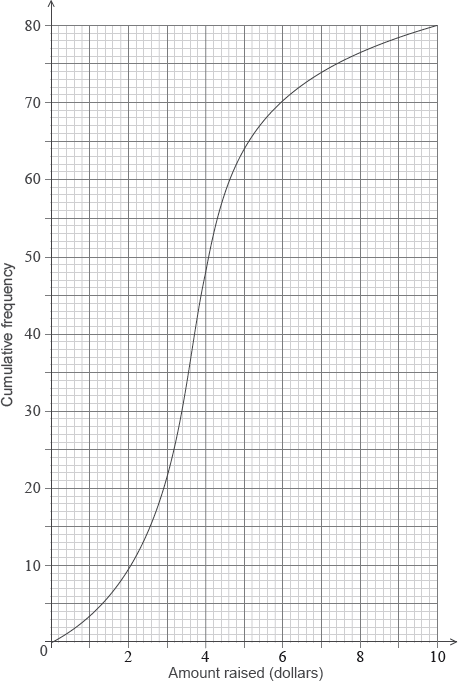
(ii) The following cumulative frequency curve shows the amounts in dollars raised by all the students in the school. Find the percentage of students in the school who raised more money than anyone in Sam’s class.
(i) Write down the new mean.
(ii) Write down the new standard deviation. [2]
▶️Answer/Explanation
Markscheme
a.valid approach (M1)
eg\(\,\,\,\,\,\)between 10th and 11th, \(\frac{{8 + 8}}{2}\)
median \( = 38\) A1 N2
[2 marks]
(i) \(a = 20\) A1 N1
(ii) valid approach (M1)
eg\(\,\,\,\,\,\)\({Q_3} – {Q_1},{\text{ }}{Q_1} + 14,{\text{ }}b – 30 = 14\)
\(b = 44\) A1 N2
[3 marks]
valid approach (M1)
egx\(\,\,\,\,\,\)\(40 \times 20,{\text{ }}\frac{{x + 745}}{{20}},{\text{ }}40 – \frac{{745}}{{20}}\)
correct working (A1)
eg\(\,\,\,\,\,\)\(800 – 745,{\text{ }}20 \times 2.75\)
55 (more cans) A1 N2
[3 marks]
(i) most cans in Sam’s class \( = 50\) (A1)
5 ($) A1 N2
(ii) correct value of 64 or 16 A1
valid approach (M1)
eg\(\,\,\,\,\,\)\(\frac{{64}}{{80}},{\text{ }}80\% ,{\text{ }}80 – 64,{\text{ }}\frac{{16}}{{80}}\)
20% A1 N2
[5 marks]
(i) 41.4 (exact) A1 N1
(ii) 18.5 A1 N1
[2 marks]
Question
There are 10 items in a data set. The sum of the items is 60.
The variance of this data set is 3. Each value in the set is multiplied by 4.
a.Find the mean.[2]
b.(i) Write down the value of the new mean.
(ii) Find the value of the new variance. [3]
▶️Answer/Explanation
Markscheme
a.correct approach (A1)
eg\(\,\,\,\,\,\)\(\frac{{60}}{{10}}\)
\({\text{mean}} = 6\) A1 N2
(i) new mean \( = 24\) A1 N1
(ii) valid approach (M1)
eg\(\,\,\,\,\,\)\({\text{variance}} \times {(4)^2},{\text{ }}3 \times 16\), new standard deviation \( = 4\sqrt 3 \)
new variance \( = 48\) A1 N2
[3 marks]
Question
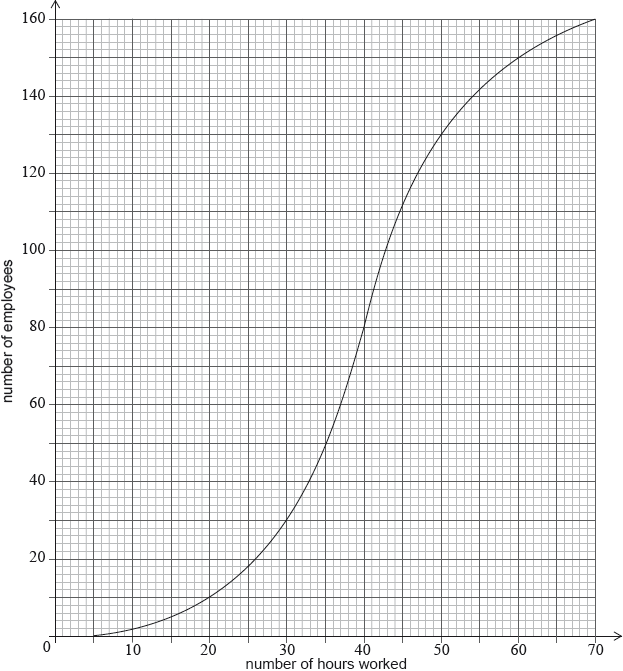
A city hired 160 employees to work at a festival. The following cumulative frequency curve shows the number of hours employees worked during the festival.
The city paid each of the employees £8 per hour for the first 40 hours worked, and £10 per hour for each hour they worked after the first 40 hours.
a.i.Find the median number of hours worked by the employees.[2]
a.ii.Write down the number of employees who worked 50 hours or less.[1]
b.i.Find the amount of money an employee earned for working 40 hours;[1]
b.ii.Find the amount of money an employee earned for working 43 hours.[3]
c.Find the number of employees who earned £200 or less.[3]
d.Only 10 employees earned more than £\(k\). Find the value of \(k\).[4]
▶️Answer/Explanation
Markscheme
a.i.evidence of median position (M1)
eg\(\,\,\,\,\,\)80th employee
40 hours A1 N2
[2 marks]
130 employees A1 N1
[1 mark]
£320 A1 N1
[1 mark]
splitting into 40 and 3 (M1)
eg\(\,\,\,\,\,\)3 hours more, \(3 \times 10\)
correct working (A1)
eg\(\,\,\,\,\,\)\(320 + 3 \times 10\)
£350 A1 N3
[3 marks]
valid approach (M1)
eg\(\,\,\,\,\,\)200 is less than 320 so 8 pounds/hour, \(200 \div 8,{\text{ }}25,{\text{ }}\frac{{200}}{{320}} = \frac{x}{{40}}\),
18 employees A2 N3
[3 marks]
valid approach (M1)
eg\(\,\,\,\,\,\)\(160 – 10\)
60 hours worked (A1)
correct working (A1)
eg\(\,\,\,\,\,\)\(40(8) + 20(10),{\text{ }}320 + 200\)
\(k = 520\) A1 N3
[4 marks]
Question
The following box-and-whisker plot shows the number of text messages sent by students in a school on a particular day.
a.Find the value of the interquartile range.[2]
b.One student sent k text messages, where k > 11 . Given that k is an outlier, find the least value of k. [4]
▶️Answer/Explanation
Markscheme
a.recognizing Q1 or Q3 (seen anywhere) (M1)
eg 4,11 , indicated on diagram
IQR = 7 A1 N2
[2 marks]
recognizing the need to find 1.5 IQR (M1)
eg 1.5 × IQR, 1.5 × 7
valid approach to find k (M1)
eg 10.5 + 11, 1.5 × IQR + Q3
21.5 (A1)
k = 22 A1 N3
Note: If no working shown, award N2 for an answer of 21.5.
[4 marks]
Question
A data set has n items. The sum of the items is 800 and the mean is 20.
The standard deviation of this data set is 3. Each value in the set is multiplied by 10.
a. Find n.[2]
b.i.Write down the value of the new mean.[1]
b.ii.Find the value of the new variance.[3]
▶️Answer/Explanation
Markscheme
a.correct approach (A1)
eg \(\frac{{800}}{n} = 20\)
40 A1 N2
[2 marks]
200 A1 N1
[1 mark]
METHOD 1
recognizing variance = σ 2 (M1)
eg 32 = 9
correct working to find new variance (A1)
eg σ 2 × 10², 9 × 100
900 A1 N3
METHOD 2
new standard deviation is 30 (A1)
recognizing variance = σ 2 (M1)
eg 32 = 9, 302
900 A1 N3
[3 marks]
Question
[Maximum mark: 5] [without GDC]
A set of data is 6, 2, 3, 8, 6, 5, 7, 6, 2. Find
(a) the measures of central tendency: mode, median, mean.
(b) the measures of spread: range, interquartile range.
▶️Answer/Explanation
mode = 6, median = 6, mean = 5,
range = 6, IQR = 6.5 – 2.5 = 4
Question
[Maximum mark: 5] [with GDC]
For the data in Exercise 1,
(a) confirm the results of questions 1(a) and 1(b) by your GDC;
(b) find the measures of spread: standard deviation and variance.
▶️Answer/Explanation
standard deviation = 2.05 variance = 2.052
Question
[Maximum mark: 7] [without GDC]
For the following 200 entries,
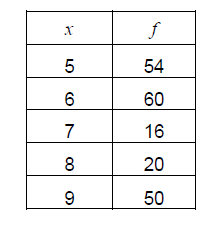
find
(a) the measures of central tendency: mode, median, mean.
(b) the measures of spread: range, interquartile range.
(c) the 65th and 70th percentiles
▶️Answer/Explanation
mode = 6, median = 6, mean = 6.76
range = 4, IQR = 8.5 – 5 = 3.5
65th percentile = 7.5 70th percentile = 8
Question
[Maximum mark: 5] [with GDC]
For the data in Exercise 3,
(a) confirm the results of questions 3(a) and 3(b) by your GDC;
(b) find the measures of spread: standard deviation and variance.
▶️Answer/Explanation
standard deviation = 1.556 variance = 1.5562
Question
[Maximum mark: 7] [without GDC]
For the data presented in the stem and leaf diagram below

(a) write down the first four entries (i.e. the smallest ones)
(b) find the measures of central tendency: mode and median,
(c) find the measures of spread: range and interquartile range
▶️Answer/Explanation
(a) 51, 53, 57, 60
(b) mode = 84, median = 78
(c) range = 48, IQR = 84 – 60 = 24
