IB PHYSICS HL(Higher level) – 2024 – Practice Questions- All Topics
Topic 1 – Measurements and uncertainties
Topic 1 Weightage : 7 %
All Questions for Topic 1 Fundamental and derived SI units , Significant figures , Orders of magnitude, Estimation , Error bars , Uncertainty of gradient and intercepts
Question
Data analysis question.
A particular semiconductor device generates an emf, which varies with light intensity. The diagram shows the experimental arrangement which a student used to investigate the variation with distance d of the emf ε. The power output of the lamp was constant. (The power
supply for the lamp is not shown.)
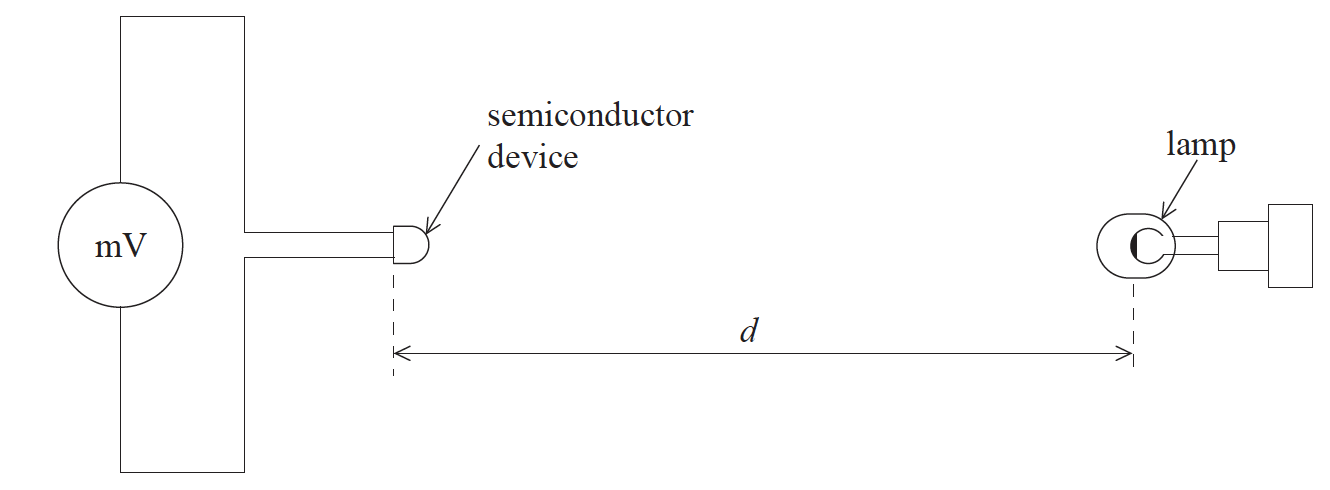
The table shows how ε varied with d.
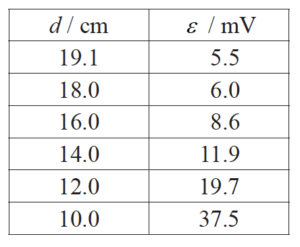
The student hypothesises that there may be an exponential relationship between ε and d of the form shown below, where a and k are constants.
ε = ae−kd
(i) Deduce a suitable unit for k.
(ii) Suggest the graph that the student should plot in order to get a straight-line graph if the hypothesis is valid.
(iii) Explain how k can be obtained from the graph in (d)(ii).
▶️Answer/Explanation
Ans:
(i) metre–1;
Allow any SI prefix
(ii) one axis loge ε /loge (ε /a);
other axis d;
(iii) k=–gradient/−reciprocal of gradient;
Minus sign must be seen.
Do not allow ECF from incorrect answer to (d)(ii).
Note:
(i) There were good attempts at finding the unit of k but many candidates failed to recognise that the power in an exponential is dimensionless, giving k the units of d-1 (i.e. m-1 or cm-1).
(ii) Although most candidates appeared to be able to perform the appropriate logarithm function to the equation many failed to take the next step and actually state what values needed to be plotted on the graph (that is, logeε vs. d).
(iii) Again, showing that the gradient was equal to –k, most ignored the minus sign and incorrectly stated that the gradient was k.
Question
Data analysis question.
The photograph below shows a magnified image of a dark central disc surrounded by concentric dark rings. These rings were produced as a result of interference of monochromatic light.
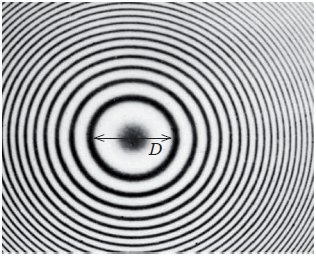
The graph below shows how the ring diameter D varies with the ring number n. The innermost ring corresponds to n = 1. The corresponding diameter is labelled in the photograph. Error bars for the diameter D are shown.
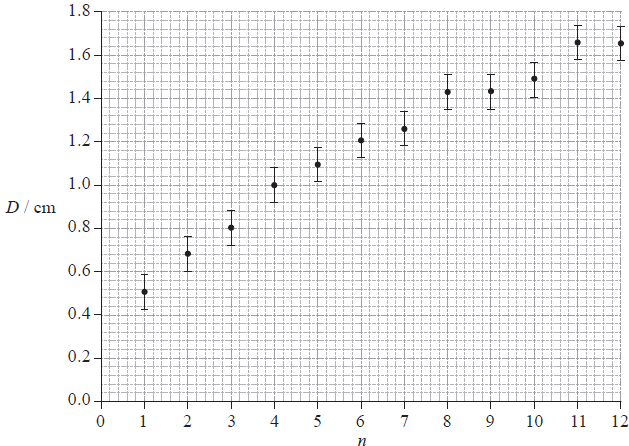
It is suggested that the relationship between D and n is of the form
D = cnp
where c and p are constants.
Explain what graph you would plot in order to determine the value of p.
▶️Answer/Explanation
Ans.
we can re-write the suggested relation as log D = log c + p log n;
now we can plot a graph of log D versus log n;
the slope of the (straight line) graph is equal to p;
Accept logs in any base.
Question
Data analysis question.
An experiment is undertaken to investigate the relationship between the temperature of a ball and the height of its first bounce.
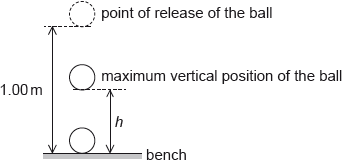
A ball is placed in a beaker of water until the ball and the water are at the same temperature. The ball is released from a height of 1.00 m above a bench. The maximum vertical height \(h\) from the bottom of the ball above the bench is measured for the first bounce. This procedure is repeated twice and an average \({h_{{\text{mean}}}}\) is calculated from the three measurements.
The procedure is repeated for a range of temperatures. The graph shows the variation of \({h_{{\text{mean}}}}\) with temperature \(T\).
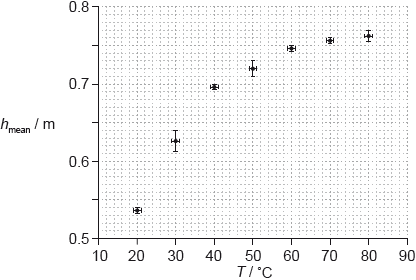
A student hypothesizes that \({h_{{\text{mean}}}}\) is proportional to \({T^2}\).
Comment, using two points on your line of best-fit, whether or not this is a valid hypothesis.[3]
Suggest why using two points cannot confirm that \({h_{{\text{mean}}}}\) is proportional to \({T^2}\).[2]
The temperature is measured using a liquid in glass thermometer. Explain why it is likely that the uncertainty in \(T\) is constant.[2]
▶️Answer/Explanation
coordinates of two points on the line correctly read from the graph; } (check points read to within half a square and ignore omission of powers of ten in reading)
\(\frac{{{T^2}}}{h}\) or \(\frac{h}{{{T^2}}}\) calculated for both values;
consistent conclusion that values similar within the (typical) experimental error so sensible / differ outside (typical) experimental error so not sensible;} (must see reference to experimental error not just bald statement)
Award [2 max] for a graph of \({h_{{\text{mean}}}}\) versus \({T^2}\) and a conclusion that hypothesis is not valid.
Do not award credit for “does not go through origin”.
two points define a straight line / any arbitrary curve can pass through two points; to confirm hypothesis third point (or more) must lie on the straight line;
or
refers to experimental error in data (and therefore error in ratio) / depending on the two points chosen the hypothesis may be confirmed;
increasing the number of data points increases the strength of conclusion;
or
one of the two points chosen may be anomalous/erroneous/outlier;
third point needed to confirm hypothesis;
same thermometer used;
same eyes used;
same reading method used;
this type of thermometer has (typically) equal graduations;
liquid in thermometer expands linearly;
