A student investigates the oscillation of a horizontal rod hanging at the end of a vertical string. The diagram shows the view from above.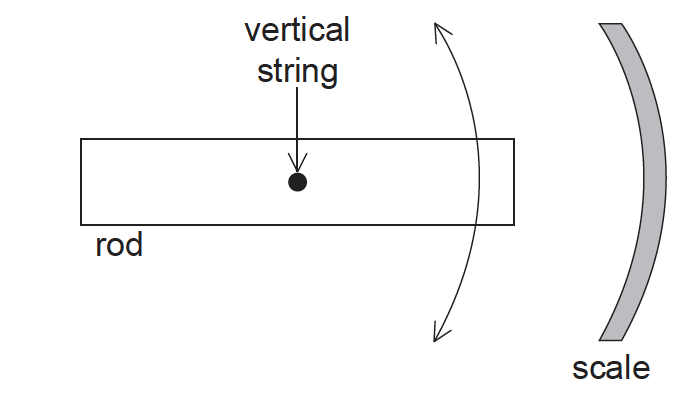
The student starts the rod oscillating and measures the largest displacement for each cycle of the oscillation on the scale and the time at which it occurs. The student begins to take measurements a few seconds after releasing the rod.
The graph shows the variation of displacement x with time t since the release of the rod. The uncertainty for t is negligible.
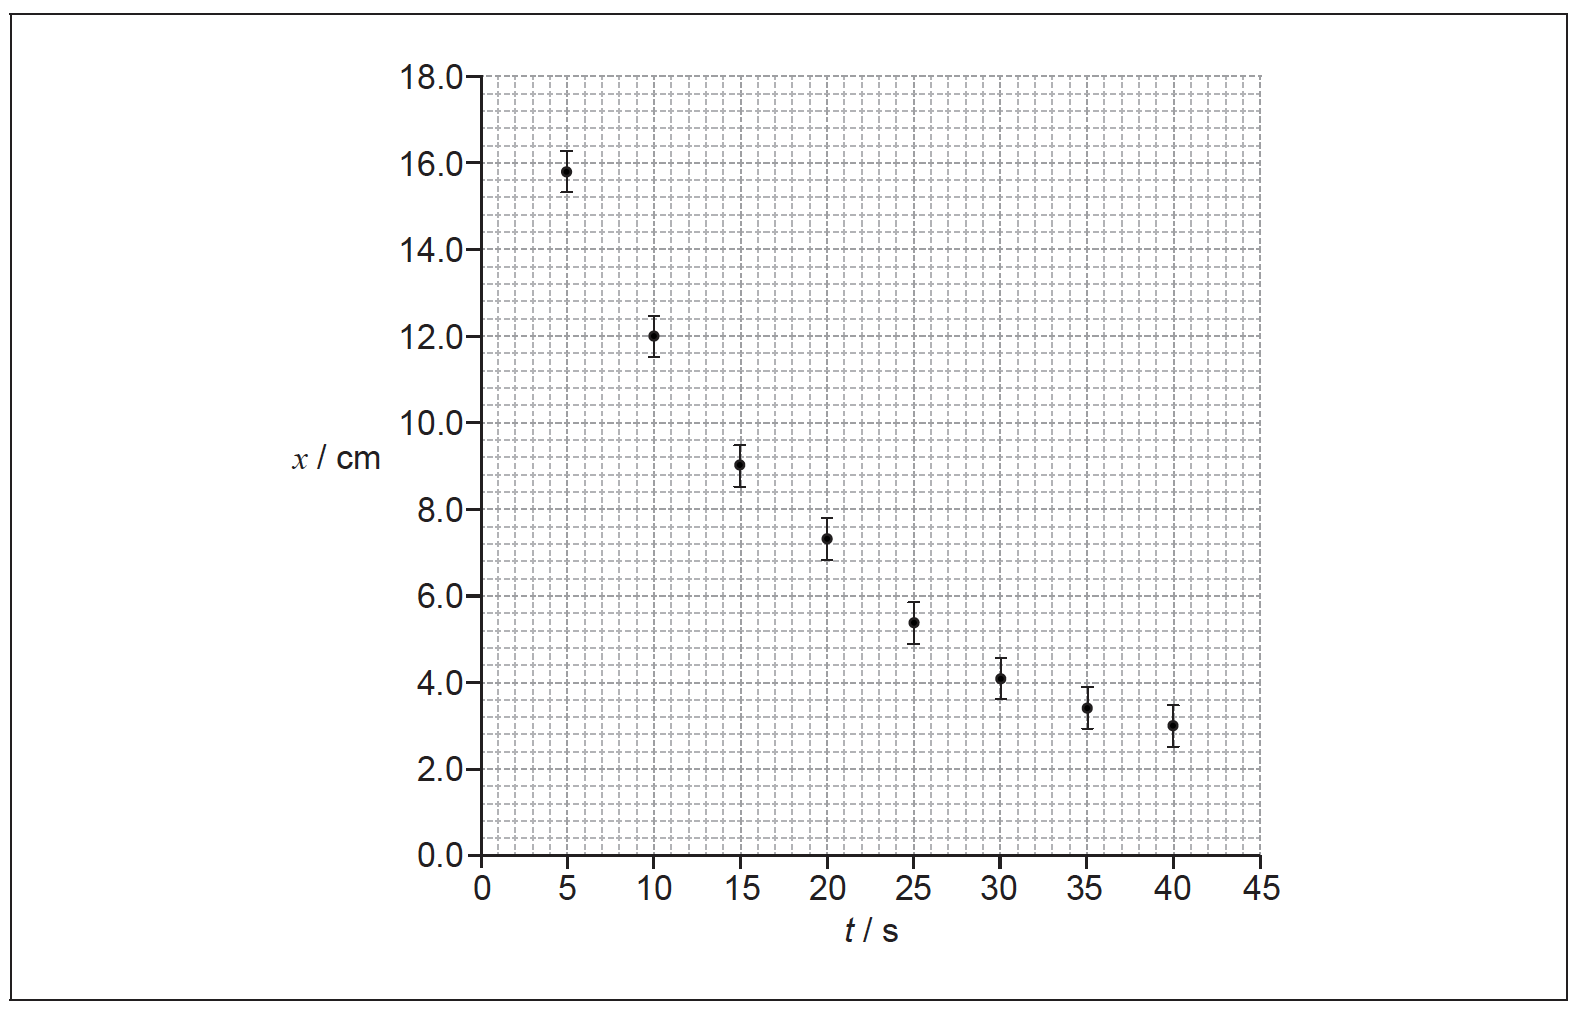
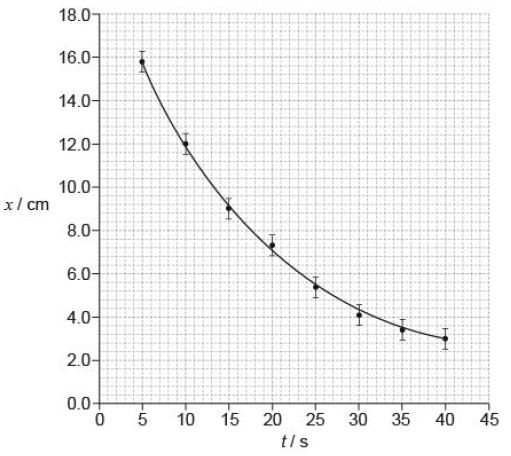
a. On the graph above, draw the line of best fit for the data.[1]
b. Calculate the percentage uncertainty for the displacement when t=40s.[2]
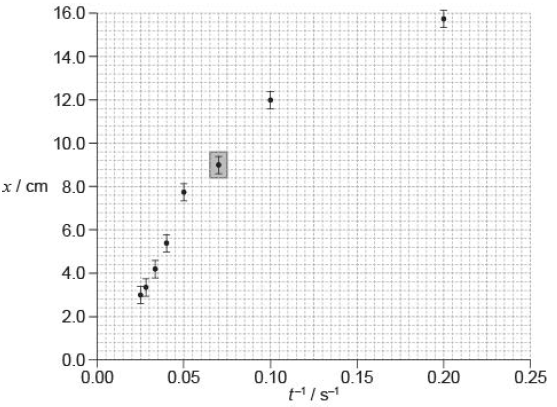
To test the hypothesis x is plotted against \(\frac{1}{t}\) as shown in the graph.
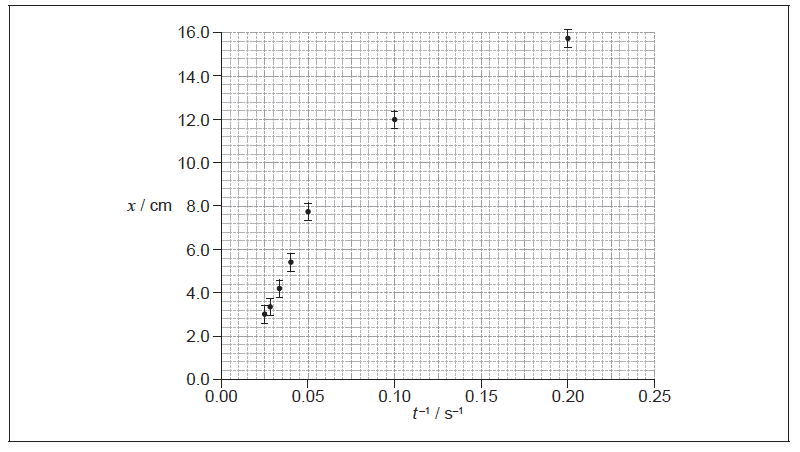
(i) The data point corresponding to t=15s has not been plotted. Plot this point on the graph above.
(ii) Suggest the range of values of t for which the hypothesis may be assumed to be correct.[3]
▶️Answer/Explanation
Markscheme
a. smooth curve passing through all error bars
«\(\frac{{0.5}}{{2.5}}\)=»20%
Accept correctly calculated value from interval 15% to 25%.
Allow any point within the grey square. The error bar is not required.
(ii) ALTERNATIVE 1
t–1 from 0.025 s–1 to 0.04 s–1
giving t from 25 to 40
ALTERNATIVE 2
the data do not support the hypothesis
any relevant support for the suggestion, eg straight line cannot be fitted through the error bars and the origin
Do not allow ECF from MP1 to MP2.
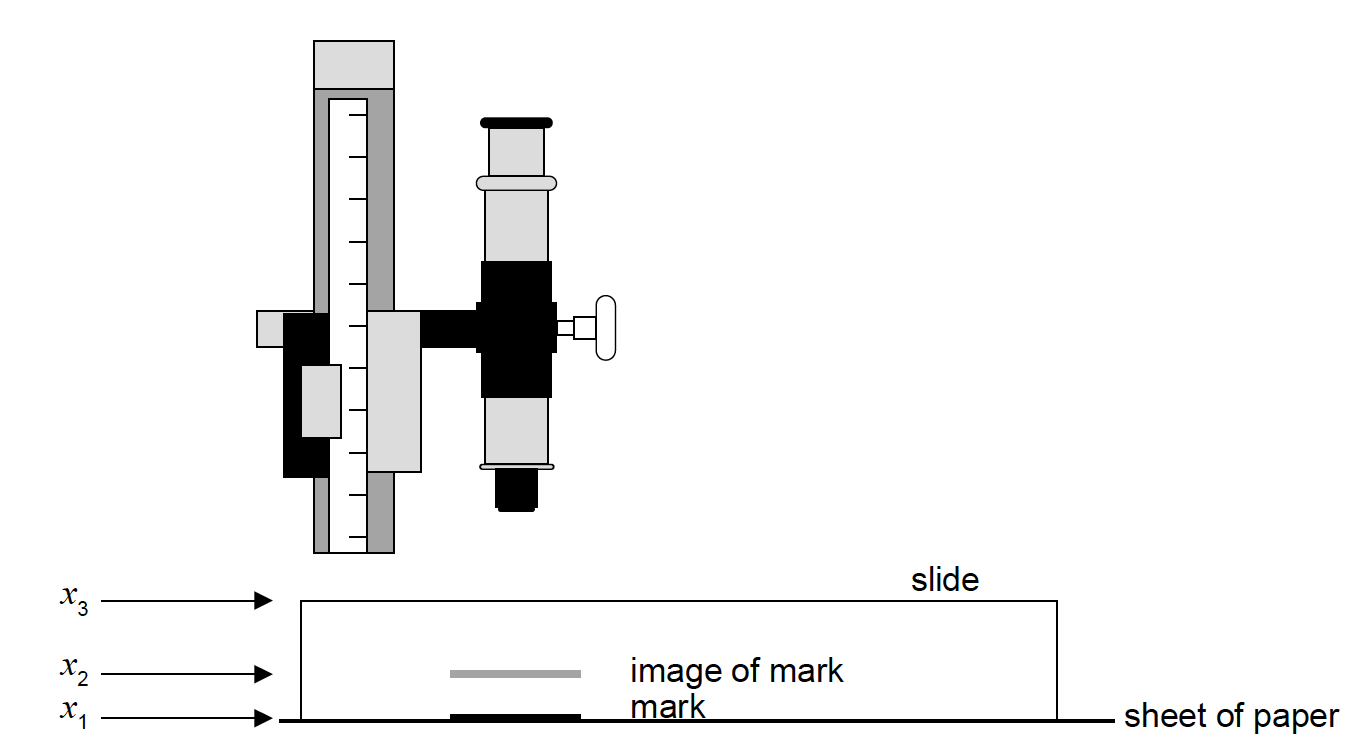
A student measures the refractive index of the glass of a microscope slide.
He uses a travelling microscope to determine the position x1 of a mark on a sheet of paper. He then places the slide over the mark and finds the position x2 of the image of the mark when viewed through the slide. Finally, he uses the microscope to determine the position x3 of the top of the slide.
The table shows the average results of a large number of repeated measurements.
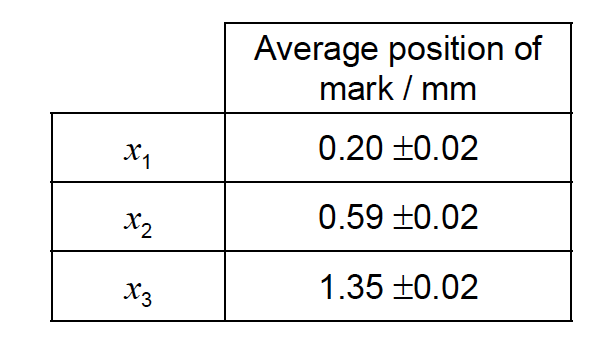
a. The refractive index of the glass from which the slide is made is given by
\[\frac{{{x_3} – {x_1}}}{{{x_3} – {x_2}}}\].
Determine
(i) the refractive index of the glass to the correct number of significant figures, ignoring any uncertainty.
(ii) the uncertainty of the value calculated in (a)(i).[4]
(i) State the name of this type of error.
(ii) Outline the effect that the error in (b)(i) will have on the calculated value of the refractive index of the glass.[3]
▶️Answer/Explanation
Markscheme
a. (i) refractive index = 1.5
Both correct value and 2SF required for [1].
(ii) fractional uncertainty \({x_3} – {x_1} = \frac{{0.04}}{{1.15}} = 0.035\) AND \({x_3} – {x_2} = \frac{{0.04}}{{0.76}} = 0.053\)
sum of fractional uncertainty = 0.088
«uncertainty = their RI × 0.088» = 0.1
Accept correct calculation using maximum and minimum values giving the same answer.
Accept “zero error/offset”.
(ii) calculated refractive index is unchanged
because both numerator and denominator are unchanged
Accept calculation of refractive index with 0.05 subtracted to each x value.
relative/absolute uncertainty will be smaller
“Constant material” is not enough for MP1.