IB Mathematics SL 4.10 Spearman’s rank correlation coefficient AI SL Paper 2 - Exam Style Questions - New Syllabus
Question
Aiden works for WoodCraft Wonders, a company that makes wooden letters. He wants to predict the demand for different letters. He thinks that letters earlier in the alphabet are more popular.
Aiden finds that, in the year he was born, his name was the most popular in the United States. From the \(10\) most popular boys’ names, his name was first alphabetically. This data is shown in the following table.
| Name | Popularity | Position in the alphabet |
|---|---|---|
| Aiden | 1 | 1 |
| Ethan | 2 | 3 |
| Jacob | 3 | 6 |
| Jayden | 4 | 7 |
| Caden | 5 | 2 |
| Noah | 6 | 9 |
| Jackson | 7 | 5 |
| Jack | 8 | 4 |
| Logan | 9 | 8 |
| Ryan | 10 | 10 |
Aiden calculates the Spearman’s rank correlation coefficient, \(r_s\), for this data.
(a) Find \(r_s\), and use the following table to interpret its value. [4]
| \(|r_s|\) | Strength |
|---|---|
| 0.000 to 0.199 | Very weak |
| 0.200 to 0.399 | Weak |
| 0.400 to 0.599 | Moderate |
| 0.600 to 0.799 | Strong |
| 0.800 to 1.000 | Very strong |
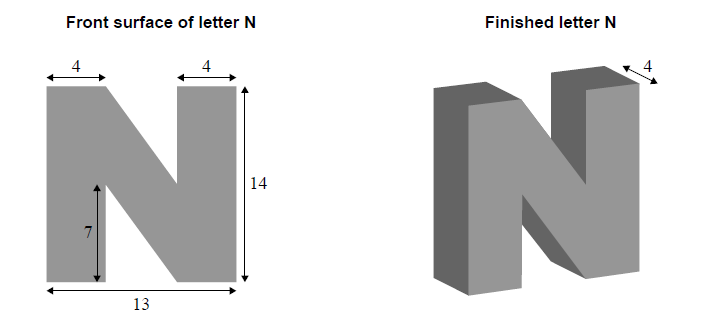
WoodCraft Wonders makes the letter \(N\) from a wooden rectangular prism with a depth of \(4\text{ cm}\). The front surface is a rectangle with a base length of \(13\text{ cm}\) and a height of \(14\text{ cm}\). Two identical right-angled triangular prisms are then cut out of the rectangular prism to make the letter \(N\), as shown in the diagram.

(b) Find the area of the front surface of the letter \(N\). [3]
(c) Calculate the volume of the finished letter \(N\). [1]
WoodCraft Wonders has two machines that make the wooden letters: Machine A and Machine B. Aiden wants to test if the machines are producing letters of different weights. A sample of wooden letters in the shape of an \(N\) are taken from both machines and weighed.
| Machine A sample (grams) | ||||||
|---|---|---|---|---|---|---|
| 355 | 342 | 361 | 343 | 328 | 376 | 364 |
| Machine B sample (grams) | ||||||
|---|---|---|---|---|---|---|
| 338 | 343 | 332 | 358 | 349 | 332 | 324 |
Aiden assumes the samples came from normally distributed populations with equal variances, and he performs a \(t\)-test at the \(5\%\) significance level.
(d)
(i) Write down the null hypothesis and the alternative hypothesis.
(ii) Find the \(p\)-value for this test.
(iii) Write down the conclusion of the test. Give a reason for your answer. [6]
Most-appropriate topic codes (IB DP Mathematics: Applications and Interpretation):
• TOPIC SL 3.1: Volume and surface area of three-dimensional solids and composite solids. (Parts b and c)
• TOPIC SL 4.11: Hypothesis testing, including the \(t\)-test; use of \(p\)-values to compare the means of two populations; interpretation of test results. (Part d)
▶️ Answer/Explanation
(a)
Use technology to calculate Spearman’s rank correlation coefficient for the two rank columns: popularity and alphabetical position.
\(r_s=0.64848\ldots\)
✅ Answer: \(r_s=0.648\) A2
Since \(0.600\leq |r_s|\leq 0.799\), the correlation is strong.
Also, since \(r_s\) is positive, it is a strong positive correlation between the ranks of the data. A1A1
Explanation: A positive value means that, generally, as one rank increases, the other rank also tends to increase. Here, the value is not close enough to \(1\) to be “very strong”, but it is clearly in the strong category.
(b)
The front surface can be found by starting with the full rectangle and subtracting the two triangular cut-outs.
Area of full rectangle:
\(13\times 14=182\)
Each triangular cut-out has base \(5\text{ cm}\) and height \(7\text{ cm}\), so the total area removed is
\(2\left(\dfrac{1}{2}\times 7\times 5\right)=35\). (M1)(A1)
Therefore,
\(\text{Area}=182-35=147\).
✅ Answer: \(147\text{ cm}^2\) A1
Explanation: The letter \(N\) is treated as a rectangular front face with two identical right-angled triangular regions removed.
(c)
The depth of the wooden letter is \(4\text{ cm}\).
\(\text{Volume}=\text{front area}\times\text{depth}\)
\(=147\times 4\)
\(=588\).
✅ Answer: \(588\text{ cm}^3\) A1
(d)(i)
The test is checking whether the two machines produce letters with different mean weights.
\(H_0:\mu_A=\mu_B\)
\(H_1:\mu_A\neq\mu_B\)
✅ Answer: \(H_0:\mu_A=\mu_B,\ H_1:\mu_A\neq\mu_B\) A1A1
Explanation: This is a two-tailed test because the question asks whether the machines produce letters of different weights, not specifically whether one machine produces heavier letters.
(d)(ii)
Using a pooled two-sample \(t\)-test, since the populations are assumed normal with equal variances:
\(p=0.101900\ldots\)
✅ Answer: \(p=0.102\) A2
(d)(iii)
Compare the \(p\)-value with the significance level \(0.05\):
\(0.102>0.05\). R1
Since the \(p\)-value is greater than \(0.05\), there is insufficient evidence to reject the null hypothesis.
✅ Conclusion: There is insufficient evidence to conclude that the machines are producing letters of different weights. A1
Explanation: The sample difference is not statistically significant at the \(5\%\) level, so we do not have enough evidence to say that the population mean weights are different.
