
3.4 – Linear Relationships, Gradient and Rate of Change
A linear relationship describes a relationship between two variables where the change in one variable is constant for equal changes in the other variable.
Linear relationships can be represented using:
- tables of values
- ordered pairs and coordinates
- graphs
- equations
- real-life situations involving a constant rate of change
What Is a Linear Relationship?
A relationship is linear when the rate of change between the variables remains constant.
For example:
| \(x\) | \(y\) |
|---|---|
| \(1\) | \(5\) |
| \(2\) | \(8\) |
| \(3\) | \(11\) |
| \(4\) | \(14\) |
When \(x\) increases by \(1\), \(y\) increases by \(3\) every time.
\(5\rightarrow8\rightarrow11\rightarrow14\)
Because the change is constant, this is a linear relationship.
A constant difference in \(y\) for equal changes in \(x\) indicates a linear relationship.
Representing a Linear Relationship
The same linear relationship can be represented in different ways.
| Representation | Example |
|---|---|
| Table | Values of \(x\) and \(y\) |
| Coordinates | \((1,5),(2,8),(3,11)\) |
| Graph | Points forming a straight line |
| Equation | A rule connecting \(x\) and \(y\) |
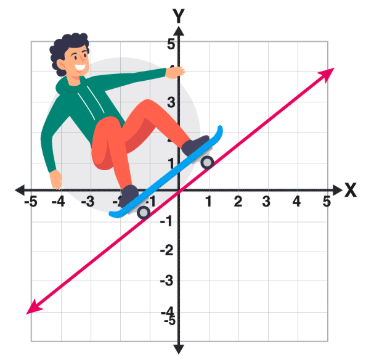
For a linear relationship, the graph forms a straight line.
Gradient
The gradient of a straight line measures how much the \(y\)-value changes when the \(x\)-value changes.
The gradient is also called the slope.
For two points \((x_1,y_1)\) and \((x_2,y_2)\), the gradient is:
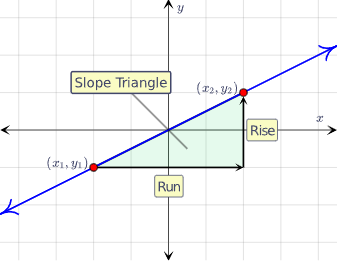
\(\boxed{m=\dfrac{y_2-y_1}{x_2-x_1}}\)
where \(m\) represents the gradient.
Gradient = rise ÷ run
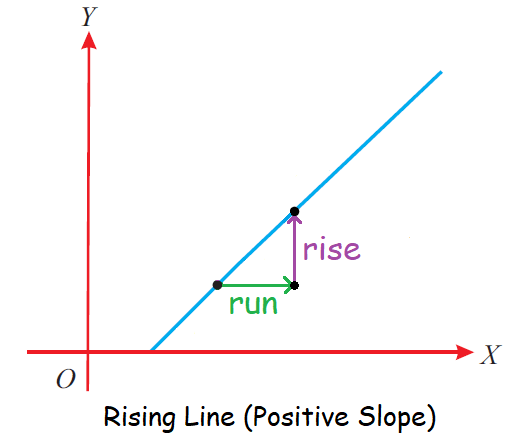
The rise is the change in \(y\).
The run is the change in \(x\).
Positive Gradient
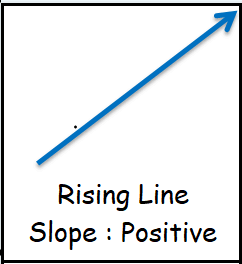
A line has a positive gradient when \(y\) increases as \(x\) increases.
For example, using the points \((2,4)\) and \((6,12)\):
\(m=\dfrac{12-4}{6-2}\)
\(m=\dfrac{8}{4}=2\)
The gradient is \(2\), so the line rises from left to right.
Negative Gradient
A line has a negative gradient when \(y\) decreases as \(x\) increases.
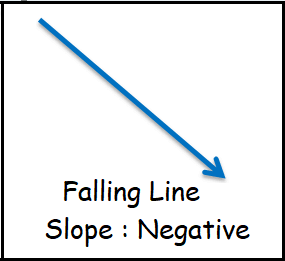
For example, using \((1,10)\) and \((5,2)\):
\(m=\dfrac{2-10}{5-1}\)
\(m=\dfrac{-8}{4}=-2\)
The negative gradient shows that \(y\) decreases as \(x\) increases.
Zero Gradient
A horizontal line has a gradient of zero.
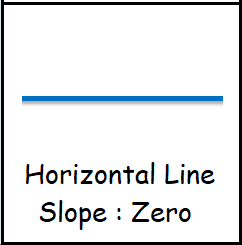
For example, using \((2,7)\) and \((8,7)\):
\(m=\dfrac{7-7}{8-2}=0\)
The \(y\)-value does not change, so the gradient is \(0\).
Interpreting Gradient
The gradient tells us the rate at which one quantity changes compared with another.
For example, if a car travels \(180\) km in \(3\) hours at a constant rate:
\(\text{Rate of change}=\dfrac{180}{3}=60\)
The rate is \(60\) km per hour.
If distance is plotted against time, this rate is represented by the gradient of the graph.
Rate of Change
The rate of change tells us how quickly one variable changes compared with another.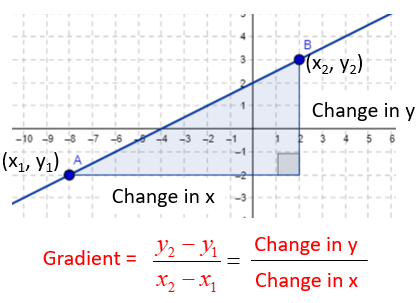
The general formula is:
\(\boxed{\text{Rate of change}=\dfrac{\text{change in output}}{\text{change in input}}}\)
For a graph of \(y\) against \(x\), this becomes:
\(\boxed{\text{Rate of change}=\dfrac{\Delta y}{\Delta x}}\)
This is the same calculation used to find the gradient of a straight line.
Units of Gradient
The units of a gradient depend on the units of \(y\) and \(x\).
| \(y\)-axis | \(x\)-axis | Gradient units |
|---|---|---|
| Distance (km) | Time (h) | km/h |
| Cost ($) | Quantity (items) | $/item |
| Temperature (°C) | Time (min) | °C/min |
Comparing Gradients
The magnitude of the gradient indicates how steep a line is.
- A larger positive gradient means a steeper line rising from left to right.
- A smaller positive gradient means a less steep rising line.
- A larger negative gradient in magnitude means a steeper decreasing line.
- A gradient of \(0\) represents a horizontal line.
For example, compare:
\(m_1=2\qquad m_2=5\)
The line with gradient \(5\) is steeper because its \(y\)-value changes more for the same change in \(x\).
Gradient from a Table
The gradient can also be found directly from a table.
| \(x\) | \(y\) |
|---|---|
| \(2\) | \(9\) |
| \(5\) | \(15\) |
Using the two points \((2,9)\) and \((5,15)\):
\(m=\dfrac{15-9}{5-2}\)
\(m=\dfrac{6}{3}=2\)
Therefore, for every increase of \(1\) in \(x\), \(y\) increases by \(2\).
When finding or interpreting a gradient:
1. Identify two points.
2. Calculate the change in \(y\).
3. Calculate the change in \(x\).
4. Divide change in \(y\) by change in \(x\).
5. Include units when the variables have units.
6. Explain what the gradient means in the context of the problem.
Example 1:
The table shows the distance travelled by a cyclist at a constant speed.
| Time \(t\) (hours) | Distance \(d\) (km) |
|---|---|
| \(1\) | \(18\) |
| \(2\) | \(36\) |
| \(3\) | \(54\) |
| \(4\) | \(72\) |
a) Explain why the relationship is linear.
b) Find the gradient of the relationship.
c) Interpret the gradient in context.
d) Find the distance travelled after \(7\) hours if the same rate continues.
▶️ Answer/Explanation
Answer
a)
For every increase of \(1\) hour, the distance increases by \(18\) km.
\(18,\ 36,\ 54,\ 72\)
The change is constant, so the relationship is linear.
b)
\(m=\dfrac{72-18}{4-1}\)
\(m=\dfrac{54}{3}=18\)
Gradient: \(18\text{ km/h}\)
c)
The cyclist travels \(18\) km for every \(1\) hour.
Rate of change: \(18\text{ km/h}\)
d)
\(18\times7=126\)
Answer: \(126\text{ km}\)
Example 2:
Two taxi companies charge according to the tables below.
| Distance \(x\) (km) | Company A Cost \(y\) ($) | Company B Cost \(y\) ($) |
|---|---|---|
| \(2\) | \(8\) | \(11\) |
| \(5\) | \(14\) | \(20\) |
| \(8\) | \(20\) | \(29\) |
a) Find the gradient for each company.
b) Explain what each gradient means.
c) Which company has the greater rate of increase in cost?
d) Find the cost charged by each company for a journey of \(12\) km if the same rate continues.
▶️ Answer/Explanation
Answer
a) Company A
\(m=\dfrac{14-8}{5-2}\)
\(m=\dfrac{6}{3}=2\)
Company A gradient: \(2\text{ dollars/km}\)
Company B
\(m=\dfrac{20-11}{5-2}\)
\(m=\dfrac{9}{3}=3\)
Company B gradient: \(3\text{ dollars/km}\)
b)
Company A’s cost increases by \(\$2\) for every additional kilometre.
Company B’s cost increases by \(\$3\) for every additional kilometre.
c)
Since \(3>2\), Company B has the greater rate of increase.
Answer: Company B
d)
Company A:
\(8+2(12-2)=28\)
Company A: \(\$28\)
Company B:
\(11+3(12-2)=41\)
Company B: \(\$41\)