
9.2 – Mean, Median, Mode and Measures of Spread
A data set can contain many values, so it is useful to describe the data using a few important numerical measures. These measures help us understand the centre and spread of a data set.
The three main measures of centre are:
- Mean – the arithmetic average
- Median – the middle value when the data is ordered
- Mode – the most frequently occurring value
The main measure of spread at this level is the range.
A measure of spread tells us how far apart the data values are.
Knowing the centre without considering the spread can give an incomplete picture of the data.
The Mean
The mean is the arithmetic average of a data set. To calculate the mean, add all the data values and divide by the number of values.
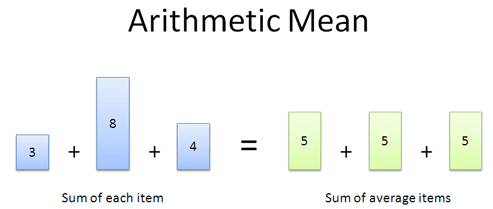
📐 Mean Formula
\( \text{Mean} = \frac{\text{sum of all data values}}{\text{number of data values}} \)
If there are \(n\) data values:
\( \bar{x} = \frac{\sum x}{n} \)
Example: Find the mean of \(6, 8, 10, 12, 14\).
\( \text{Sum} = 6+8+10+12+14=50 \)
\( n=5 \)
\( \text{Mean}=\frac{50}{5}=10 \)
Therefore, the mean is 10.
The mean does not have to be one of the original data values. For example, the mean of \(2,4,7\) is \( \frac{13}{3} \), which is not in the data set.
Finding a Missing Value from the Mean
Sometimes the mean and some of the data values are known, but one value is missing. We can work backwards to find the missing value.
Useful Relationship
\( \text{Total of data values} = \text{Mean} \times \text{Number of values} \)
For example, if the mean of \(5\) values is \(12\):
\( \text{Total}=12\times5=60 \)
If four values have a total of \(47\), the missing value is:
\(60-47=13\)
The Median
The median is the middle value of an ordered data set. The data must be arranged from smallest to largest before finding the median.
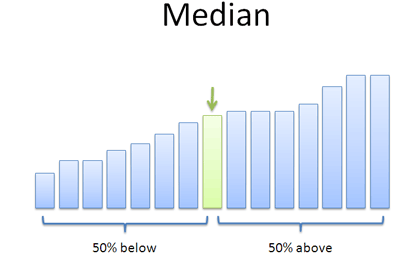
🧠 Median Rule
Odd number of values: There is one middle value.
Even number of values: There are two middle values, so find their average.
Example 1: Odd number of values
\(4,\ 7,\ 9,\ 12,\ 15\)
There are \(5\) values, so the third value is the middle value.
\( \text{Median}=9 \)
Example 2: Even number of values
\(3,\ 6,\ 8,\ 11,\ 14,\ 18\)
There are \(6\) values, so the two middle values are \(8\) and \(11\).
\( \text{Median}=\frac{8+11}{2}=9.5 \)
Therefore, the median is 9.5.
Do not find the median before ordering the data. Always arrange the values from smallest to largest first.
The Mode
The mode is the value that occurs most frequently in a data set.
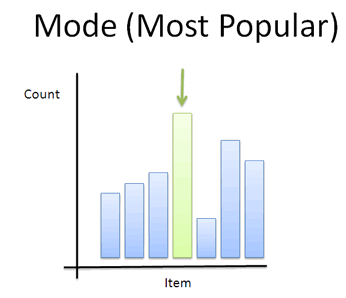
For example:
\(3,\ 5,\ 5,\ 7,\ 8,\ 5,\ 9\)
The value \(5\) occurs three times, more than any other value. Therefore:
\( \text{Mode}=5 \)
A data set can have:
- One mode – one value occurs most often.
- Two modes – two values occur equally often and more frequently than the others.
- No mode – no value occurs more often than the others.
If there are two modes, the data set is called bimodal.
Example:
\(2,\ 3,\ 3,\ 4,\ 5,\ 5,\ 6\)
Both \(3\) and \(5\) occur twice, so the data is bimodal.
\( \text{Modes}=3\text{ and }5 \)
Range – Measuring the Spread
The range measures how far the smallest and largest values are apart. It is found by subtracting the minimum value from the maximum value.
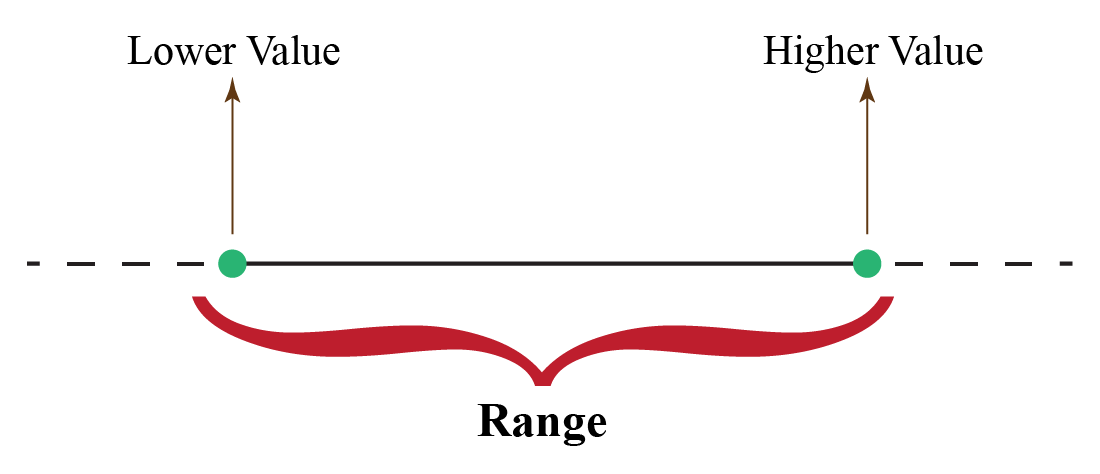
📐 Range Formula
\( \text{Range}=\text{Maximum}-\text{Minimum} \)
Example: Find the range of:
\(12,\ 18,\ 9,\ 25,\ 14,\ 20\)
\( \text{Maximum}=25 \)
\( \text{Minimum}=9 \)
\( \text{Range}=25-9=16 \)
Therefore, the range is 16.
A larger range generally indicates that the data values are more spread out, while a smaller range indicates that the values are closer together.
Comparing Mean, Median, Mode and Range
| Measure | What does it tell us? | How is it found? |
|---|---|---|
| Mean | The arithmetic average. | Add all values and divide by the number of values. |
| Median | The middle of the ordered data. | Order the data and find the middle value. |
| Mode | The most frequently occurring value. | Find the value with the greatest frequency. |
| Range | The spread from the smallest to largest value. | Maximum minus minimum. |
Choosing a Measure of Centre
Different measures can be useful for different situations.
- The mean uses every value in the data set, so it gives an overall average. However, a very large or very small value can change the mean considerably.
- The median depends on the position of the values rather than their exact distances from one another. It can therefore be useful when the data contains an unusual very large or very small value.
- The mode is particularly useful when we want to know the most common value or category.
| Situation | Useful measure |
|---|---|
| Finding an overall average | Mean |
| Data contains a very unusual value | Median may give a better description of the centre. |
| Finding the most common value | Mode |
Effect of an Outlier
An outlier is a value that is unusually far from the other values in a data set.
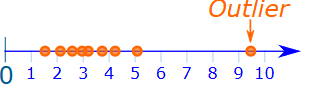
Consider the two data sets:
\(8,\ 9,\ 10,\ 10,\ 11,\ 12\)
\(8,\ 9,\ 10,\ 10,\ 11,\ 30\)
The value \(30\) is much larger than the other values. It has a strong effect on the mean because the mean uses every value in the calculation.
The median is less affected because it depends mainly on the position of the middle values.
💡 Remember
An unusually large or small value can pull the mean towards itself. When interpreting a data set, always check whether an unusual value may be affecting the mean.
Comparing Two Data Sets
When comparing two data sets, do not look only at the mean. A good comparison should consider both the centre and the spread.
For example:
| Data Set A | Data Set B |
|---|---|
| \(8,9,10,10,11,12\) | \(3,7,10,10,13,17\) |
Both sets have the same median, but Data Set B has a greater range. Therefore, Data Set B has greater spread.
🎯 Exam Tip
When comparing data sets, use complete statements such as:
“Data Set A has a smaller range, so its values are less spread out than those in Data Set B.”
Do not simply write “A is better” without explaining why.
Mean from a Frequency Table
When a value occurs many times, a frequency table can be used to calculate the mean without writing every value separately.
For each value, multiply the value by its frequency. Then add these products and divide by the total frequency.
📐 Mean from a Frequency Table
\( \text{Mean}=\frac{\sum (x\times f)}{\sum f} \)
where \(x\) is the value and \(f\) is its frequency.
| Score \(x\) | Frequency \(f\) | \(x\times f\) |
|---|---|---|
| 4 | 2 | 8 |
| 5 | 3 | 15 |
| 6 | 4 | 24 |
| 7 | 1 | 7 |
| Total | 10 | 54 |
\( \text{Mean}=\frac{54}{10}=5.4 \)
Important Relationships
Mean:
\( \text{Mean}=\frac{\text{Sum}}{\text{Number of values}} \)
Median:
Middle value of ordered data.
Mode:
Most frequently occurring value.
Range:
\( \text{Range}=\text{Maximum}-\text{Minimum} \)
Example 1:
The scores of eight students on a mathematics quiz are:
\(12,\ 15,\ 18,\ 15,\ 20,\ 17,\ 15,\ 22\)
a) Find the mean score.
b) Find the median score.
c) Find the mode.
d) Find the range.
e) A new score of \(40\) is added to the data set. Explain which measure of centre is likely to be affected most by this new value.
f) Explain what the range tells you about the original data.
▶️ Answer/Explanation
a) Mean
\(12+15+18+15+20+17+15+22=134\)
\(n=8\)
\( \text{Mean}=\frac{134}{8}=16.75 \)
Answer: The mean score is 16.75.
b) Median
First arrange the scores in ascending order:
\(12,\ 15,\ 15,\ 15,\ 17,\ 18,\ 20,\ 22\)
There are \(8\) values, so the middle values are the 4th and 5th values.
\( \text{Median}=\frac{15+17}{2}=16 \)
Answer: The median is 16.
c) Mode
The value \(15\) occurs three times, more than any other value.
Answer: The mode is 15.
d) Range
\( \text{Range}=22-12=10 \)
Answer: The range is 10.
e) Effect of the new value
The new value \(40\) is much larger than the other scores. It will have a strong effect on the mean because every value is included in the mean calculation. The median is affected much less because it depends on the middle positions.
Answer: The mean is affected most.
f) Interpretation of the range
The range of \(10\) means that the difference between the highest and lowest scores is \(10\) marks.
Final Answer: The scores are spread across an interval of \(10\) marks.
Example 2:
Two groups of students record the number of minutes they spend exercising each day.
| Group A | Group B |
|---|---|
| \(20,\ 25,\ 25,\ 30,\ 30,\ 35,\ 35\) | \(10,\ 20,\ 25,\ 30,\ 35,\ 40,\ 50\) |
a) Find the mean for each group.
b) Find the median for each group.
c) Find the mode for each group.
d) Find the range for each group.
e) Which group has the greater spread? Explain using the range.
f) Which group has the larger typical value if the median is used as the measure of centre?
g) Explain why looking at both a measure of centre and a measure of spread gives more information than looking at only one measure.
▶️ Answer/Explanation
a) Means
For Group A:
\(20+25+25+30+30+35+35=200\)
\( \text{Mean}=\frac{200}{7}\approx28.57 \)
For Group B:
\(10+20+25+30+35+40+50=210\)
\( \text{Mean}=\frac{210}{7}=30 \)
Answers: Group A mean \(\approx28.57\) minutes; Group B mean \(=30\) minutes.
b) Medians
Both groups contain \(7\) values, so the 4th value is the median.
\(\text{Median of Group A}=30\)
\(\text{Median of Group B}=30\)
Answer: Both groups have a median of 30 minutes.
c) Modes
In Group A, \(25\), \(30\), and \(35\) each occur twice. Therefore, Group A is multimodal with modes:
\(25,\ 30,\ 35\)
In Group B, every value occurs once, so there is no mode.
d) Ranges
Group A:
\(35-20=15\)
Group B:
\(50-10=40\)
Answers: Group A range \(=15\) minutes; Group B range \(=40\) minutes.
e) Greater spread
Group B has the greater spread because its range is \(40\) minutes compared with \(15\) minutes for Group A.
f) Larger typical value using the median
Both groups have a median of \(30\) minutes. Therefore, neither group has a larger median.
g) Why centre and spread should both be considered
The medians are the same, but the ranges are very different. Group A’s exercise times are much more closely grouped, while Group B’s times are more widely spread.
Therefore, the median alone does not describe the whole distribution. The range gives additional information about how varied the data is.
Final Conclusion: Both groups have the same median, but Group B has much greater variability in daily exercise time.
🚨 Common Mistakes
1. Finding the median without first ordering the data.
2. Forgetting to average the two middle values when there is an even number of data values.
3. Confusing the mode with the median.
4. Calculating the range as maximum plus minimum instead of maximum minus minimum.
5. Dividing the sum by the wrong number when calculating the mean.
6. Assuming the mean must be one of the values in the data set.
7. Looking only at the mean when comparing two data sets and ignoring the spread.
8. Forgetting that an unusually large or small value can strongly affect the mean.
Mean:
\( \text{Mean}=\frac{\text{sum of values}}{\text{number of values}} \)
Median:
The middle value of an ordered data set.
Mode:
The most frequently occurring value.
Range:
\( \text{Range}=\text{Maximum}-\text{Minimum} \)
Centre:
Mean, median and mode describe the centre of a data set.
Spread:
The range describes how far apart the smallest and largest values are.
Outlier:
An unusually large or small value can have a strong effect on the mean.
Comparison:
A complete comparison should consider both the centre and the spread.