
9.8 – Probability from Tables and Venn Diagrams
Probability questions can involve more than one category or event. Two-way tables and Venn diagrams are useful ways to organise this information and calculate probabilities.
Both representations help us identify outcomes such as:
- an event occurring
- two events occurring together
- an event occurring but not another event
- at least one event occurring
- neither event occurring
Two-Way Tables
A two-way table organises data using two categories. One category is placed in the rows and the other category is placed in the columns.
For example, suppose \(40\) students are asked whether they play football and whether they play basketball.
| Basketball | Not Basketball | Total | |
|---|---|---|---|
| Football | 12 | 8 | 20 |
| Not Football | 10 | 10 | 20 |
| Total | 22 | 18 | 40 |
Reading a Two-Way Table
Each cell gives the number of students belonging to both the row and column categories.
The value \(12\) means that \(12\) students play football and basketball.
The totals along the edges are called marginal totals. They tell us the total number in each row or column.
Finding Probability from a Two-Way Table
When a person is selected at random, the probability of an event is:
Formula
From the table above:
There are \(20\) students who play football.
There are \(22\) students who play basketball.
Probability of Both Events
To find the probability that a student plays both football and basketball, use the cell where the two categories intersect.
From the table, \(12\) students play both sports.
Venn Diagrams
A Venn diagram represents events using circles inside a rectangle representing the entire group or universal set.
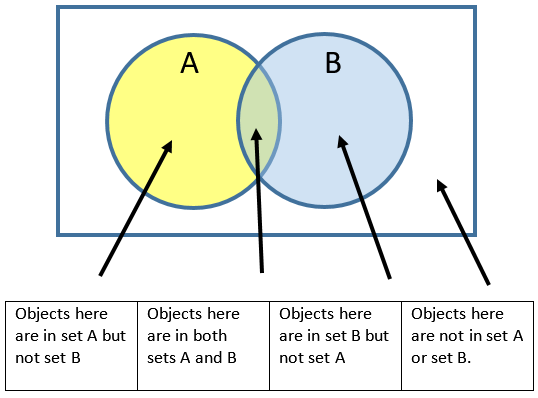
For two events \(A\) and \(B\):
| Region | Meaning |
|---|---|
| Inside A only | A occurs but B does not. |
| Inside B only | B occurs but A does not. |
| Overlap | Both A and B occur. |
| Outside both circles | Neither A nor B occurs. |
Important Probability Language
| Words | Meaning |
|---|---|
| A and B | The overlap of A and B. |
| A only | A but not B. |
| B only | B but not A. |
| A or B | A, B, or both. |
| Neither A nor B | Outside both circles. |
Finding Probability from a Venn Diagram
The same basic probability rule applies:
Finding “A or B”
“A or B” means that A occurs, B occurs, or both occur. Therefore, include all regions inside either circle.
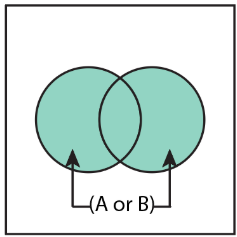
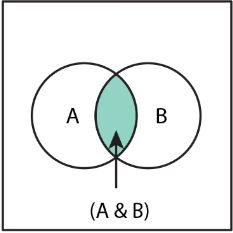
When A and B overlap, the overlap must be counted only once.
If \(A\) has \(18\) students, \(B\) has \(14\) students, and \(7\) students belong to both:
If there are \(30\) students altogether:
Finding “Neither A nor B”
“Neither A nor B” means that the outcome is outside both circles.
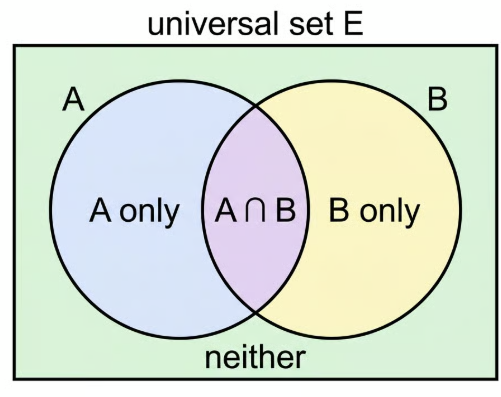
If there are \(30\) students altogether and \(25\) are in A or B, then the number in neither group is:
Therefore:
Completing a Venn Diagram
When a question gives totals instead of every individual region, work from the overlap first, then find the “only” regions, and finally find the number outside both circles.
Useful method:
- Find the number in both groups.
- Subtract the overlap from each group total to find the “only” regions.
- Add all regions inside the circles.
- Subtract from the total to find the number outside both circles.
- Use the required region(s) to calculate the probability.
Connecting Two-Way Tables and Venn Diagrams
A two-way table and a Venn diagram can represent the same information in different ways.
| Two-Way Table | Venn Diagram Region |
|---|---|
| A and B | Overlap |
| A and not B | A only |
| Not A and B | B only |
| Not A and not B | Neither |
Checking Your Table or Venn Diagram
A useful way to check your work is to make sure that all outcomes have been accounted for.
For a Venn diagram:
For a two-way table:
Common Mistakes
| Mistake | Correct Approach |
|---|---|
| Using the total for a row when the question asks for “both”. | Use the intersection cell or overlap. |
| Counting the overlap twice when finding “A or B”. | Count the overlap only once. |
| Forgetting the students outside both circles. | Remember that “neither” is represented outside both circles. |
| Using the wrong denominator. | Use the total number of possible outcomes unless the question gives a different sample group. |
| Confusing “and” with “or”. | “And” means the overlap; “or” includes all regions belonging to either event. |
MYP 3 Exam Tips
- Always identify the total number of outcomes.
- For a two-way table, carefully identify the correct row and column.
- For a Venn diagram, identify whether the question refers to only, both, at least one, or neither.
- The overlap represents both events.
- “At least one” means everything inside either circle, including the overlap.
- “Neither” means outside both circles.
- Check that all regions add to the total before calculating the probability.
- Give your final probability in a simplified fraction, decimal, or percentage as requested.
Example 1:
A school surveys \(50\) students about whether they play football and basketball.
| Basketball | Not Basketball | Total | |
|---|---|---|---|
| Football | 15 | 10 | 25 |
| Not Football | 8 | 17 | 25 |
| Total | 23 | 27 | 50 |
Find the probability that a randomly selected student:
a) plays football
b) plays both football and basketball
c) plays football but not basketball
d) does not play either sport
e) plays football or basketball
▶️ Answer/Explanation
Answer
a) Plays football
There are \(25\) students who play football out of \(50\).
Answer: \(\frac{1}{2}\)
b) Plays both football and basketball
The intersection of the two categories is \(15\).
Answer: \(\frac{3}{10}\)
c) Plays football but not basketball
Use the Football and Not Basketball cell: \(10\).
Answer: \(\frac{1}{5}\)
d) Does not play either sport
This is the Not Football and Not Basketball cell: \(17\).
Answer: \(\frac{17}{50}\)
e) Plays football or basketball
Count everyone who plays at least one of the two sports:
Therefore:
Answer: \(\frac{33}{50}\)
Example 2:
In a class of \(40\) students, \(24\) students study French, \(18\) students study Spanish, and \(10\) students study both languages.
a) Find the number of students who study French only.
b) Find the number of students who study Spanish only.
c) Find the number of students who study neither language.
d) Find the probability that a randomly selected student studies at least one of the two languages.
e) Find the probability that the student studies French but not Spanish.
▶️ Answer/Explanation
Answer
a) French only
The \(10\) students studying both languages are included in the total of \(24\) French students.
Answer: \(14\) students
b) Spanish only
Answer: \(8\) students
c) Neither language
First find the number studying at least one language:
Therefore:
Answer: \(8\) students
d) Probability of at least one language
There are \(32\) students who study at least one language.
Answer: \(\frac{4}{5}\)
e) Probability of French but not Spanish
French only \(=14\).
Answer: \(\frac{7}{20}\)