IB MYP 4-5 Biology Chapter 1 : Energy–Practice Questions

Question:

In the diagram of ATP, what do the letters C, H, N, O and P represent?

▶️Answer/Explanation

Ans: Carbon, hydrogen, nitrogen, oxygen and phosphorus.

Question:

What do the single and double lines represent?

▶️Answer/Explanation

Ans: Single and double covalent bonds.

Question:

What are the names of each of the differently colored parts of the molecule?

▶️Answer/Explanation

Ans: Red = three phosphates, black = sugar/ribose, blue = adenine/base.

Question:

What is removed from ATP to make

a) ADP,

▶️Answer/Explanation

Ans: One phosphate group.

b) AMP and

▶️Answer/Explanation

Ans: Two phosphate groups.

c) adenosine?

▶️Answer/Explanation

Ans: Three phosphate groups.

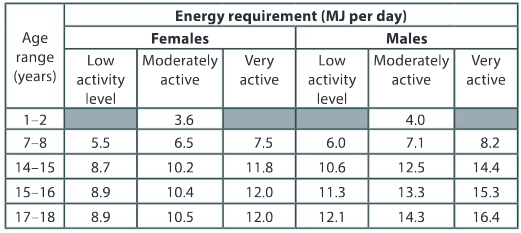
The table shows the energy requirements of different groups of humans.

Question:

State two processes in human cells which require energy.

▶️Answer/Explanation

Ans: Synthesis of DNA/protein/large molecules/anabolism; pumping ions/active transport; movement/muscle contraction.

Question:

Suggest a reason for increasing energy requirements as boys grow older.

▶️Answer/Explanation

Ans: Body size increase/more cells.

Question:

a) Calculate the percentage increase in energy requirement for a 14–15-year-old boy that stops playing computer games and starts training with a football team.

▶️Answer/Explanation

Ans: [(14.4 – 10.6)/10.6]×100% = 35.8%

b) Explain how the extra energy is used in the boy’s body.

▶️Answer/Explanation

Ans: Muscle contraction; increase in muscle size.

Question:

Explain what will happen in a boy’s or girl’s body if:

a) they eat food each day containing more energy than their requirement

▶️Answer/Explanation

Ans: Body fat deposited/spare energy stored/becoming overweight/obese.

b) they eat food each day containing less energy than their requirement.

▶️Answer/Explanation

Ans: Loss of body mass/lack of energy/hunger.

Question:

a) State the trends in energy requirement as boys and girls grow from 15–16 to 17–18 years old.

▶️Answer/Explanation

Ans: Little/no significant change in females; boys’ energy requirements increase; at all energy levels.

b) Suggest a reason for the different trends in boys and girls.

▶️Answer/Explanation

Ans: Boys in growth period (spurt) but girls are not.

Question:

Draw a bar chart to display the energy requirements for moderately active boys and girls, for all boys or for all girls.

▶️Answer/Explanation

Ans: Energy scale on yaxis with legend; ages and sexes indicated on xaxis; bars on chart all correctly plotted (ten bars in total).

Question:

How was the camera able to measure the temperature of the spider and the hands?

▶️Answer/Explanation

Ans: Objects at different temperatures emit different wavelengths of infrared; different wavelengths show as different colours.

Question:

Which was losing more heat to the surroundings, the spider or the hands? Give reasons for your answer.

▶️Answer/Explanation

Ans: Hands are losing more heat; hotter objects lose more heat than cooler ones; spider is at 22.8 °C or less and hands are at 35.9 °C or more.

Question:

Explain the temperature difference between the palms of the hands and the fingers.

▶️Answer/Explanation

Ans: Palms have better blood supply than fingers; fingers have larger surface area to volume ratio than palms so lose heat (relatively) faster; extremities of body are cooler.

Question:

Was the spider losing heat to the environment or gaining heat from it?Explain your answer.

▶️Answer/Explanation

Ans: Surroundings are blue in the photograph so are at 22.8 °C or less; spider is also at 22.8 °C or less; not clear if spider was warmer or cooler than the environment so direction of heat movement not certain; spider was gaining heat from the hands because they were warmer.

Question:

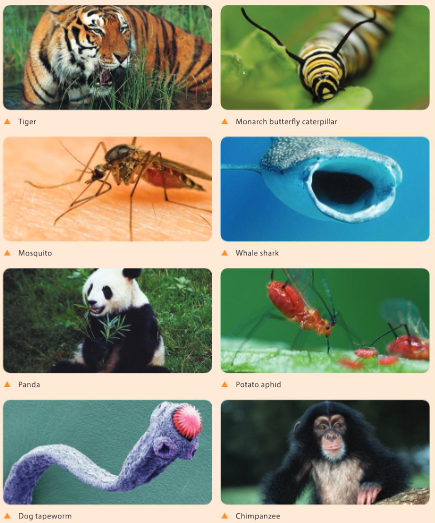
Study the photographs in the table and deduce the trophic level of each organism.

▶️Answer/Explanation

Ans: Tiger is a second consumer; monarch butterfly caterpillar is a primary consumer; mosquito is a second consumer; whale shark is a second consumer (assuming the zooplankton it feeds on are primary consumers); panda is a primary consumer; potato aphid is a primary consumer; dog tapeworm is a tertiary consumer; chimp is a primary consumer when it eats plants but is a secondary consumer when it eats monkeys/other primary consumers.

Question:

a) What is the only thing that has entered the mesocosm since it was set up?

▶️Answer/Explanation

Ans: Light/(energy)/(heat).

b) What is the only thing that was lost from the mesocosm?

▶️Answer/Explanation

Ans: Heat/(energy)/(light).

Question:

Explain whether bacteria that rely on aerobic respiration for their energy could survive in the mesocosm.

▶️Answer/Explanation

Ans: Aerobic bacteria can survive using oxygen from photosynthesizing microbes.

Question:

Explain whether life could be sustained in the mesocosm for millions of years, or whether it will inevitably die out after a time.

▶️Answer/Explanation

Ans: Could be sustained as long as light continues to be received; minerals/elements can be recycled endlessly.

Question:

Discuss whether larger organisms than bacteria could evolve in the mesocosm. 

▶️Answer/Explanation

Ans: Larger organisms could evolve as a result of mutation and natural selection; small size of a mesocosm makes it unlikely that a viable population of a large organism could be sustained.

Question:

Suggest a reason for the lack of photosynthesis in this ecosystem.

▶️Answer/Explanation

Ans: Little/no light penetrates to deep water; water very turbid so poor light penetration.

Question:

State which group of organisms releases most energy in the form of heat from respiration.

▶️Answer/Explanation

Ans: Bacteria and other microbes release the most heat.

Question:

a) Of the 4960 kJ of energy that the detritivores take in, 33.7% is lost as heat. Calculate the percentage of the energy taken in by carnivores that is lost from them as heat.

▶️Answer/Explanation

Ans: (1705/2790)×100% = 61.1%

b) Suggest reasons for the difference in the percentage of energy taken in that is lost as heat.

▶️Answer/Explanation

Ans: Carnivores are more active; carnivores use energy to hunt prey.

Question:

Deduce with reasons whether this is an open or a closed system.

▶️Answer/Explanation

Ans: Open system; both energy and materials can enter and leave.

Question:

a) Calculate the amount of energy taken in by producers that does not pass to primary consumers.

▶️Answer/Explanation

Ans: 87,400 14,150 = 73,250 kJ m2 year1

b) Suggest two possibilities for what happens to this energy, assuming that the producers do not have more energy at the end of the year than at the start.

▶️Answer/Explanation

Ans: Released by respiration and lost as heat; accumulates as extra producer biomass; producers die and their energy passes to decomposers.

Question:

a) Of the energy taken in by primary consumers, 43.5% eventually passes to secondary consumers. Calculate the percentage of energy taken in by secondary consumers that passes to tertiary consumers.

▶️Answer/Explanation

Ans: 87,400 – 14,150 = 73,250 kJ m-2 year-1

b) Explain how energy can pass from one consumer to another.

▶️Answer/Explanation

Ans: Consumers take in the chemical energy in tissues/bodies of the organisms that they eat.

Question:

There are no quaternary consumers in this ecosystem. Explain the reasons for this. 

▶️Answer/Explanation

Ans: Not enough energy in tertiary consumers to sustain a population of quaternary consumers.

Summative assessment: Palm oil

Question:

Energy cannot be created or destroyed but can change from one form to another. Deduce what change happens in these cases.

a) Rainforest is cut down and burned to clear land for oil palm plantations.

▶️Answer/Explanation

Ans: Chemical energy to heat energy.

b) Peat swamps are drained, allowing the peat to oxidize.

▶️Answer/Explanation

Ans: Chemical to heat.

c) Sunlight is absorbed by palm leaves and oil is produced.

▶️Answer/Explanation

Ans: Light to chemical.

d) Palm oil is used as biodiesel in a vehicle. 

▶️Answer/Explanation

Ans: Chemical to kinetic.

e) Food containing palm oil is eaten by a person in Europe or the USA.

▶️Answer/Explanation

Ans: Chemical to chemical/heat/kinetic.

Question:

The diagrams here show energy flows between trophic groups of animals in a natural rainforest (left) and an oil palm plantation (right). The animal groups are primary consumers (green), detritivores (yellow), carnivores (red) and omnivores (blue). The size of the circles indicates the biomass of the groups of animals and the width of the arrows indicates the amount of energy flowing from one group to another.

a) Compare and contrast the source of energy for herbivores and detritivores in the natural rainforest. 

▶️Answer/Explanation

Ans: More energy available for detritivores than herbivores; herbivores eat living plants whereas detritivores eat dead leaves/dead organic matter; both can get energy from plants.

b) What changes in energy flow happen when an area of natural rainforest is replaced by an oil palm plantation? 

▶️Answer/Explanation

Ans: All energy flows are reduced.

c) State the reason for the much lower biomass of carnivores in the oil plantation than in the natural rainforest.

▶️Answer/Explanation

Ans: Smaller biomass of detritivores and primary consumers (though the biomass of omnivores is greater).

d) Suggest a reason for a higher biomass of omnivores in the oil palm plantation than the natural rainforest.

▶️Answer/Explanation

Ans: Less predation by carnivores; food supplies more variable so advantage in having a flexible diet.

Question:

One hundred years ago there were probably more than 230,000 orangutan (Pongo pygmaeus) in their natural tropical rainforest habitats on Borneo and Sumatra. Population estimates by the
World Wide Fund for Nature in 2016 were 41,000 on Borneo and 7,500 on Sumatra. The maps here show the parts of Borneo that orangutan inhabited in 1930 and the parts of the island where there was natural intact forest, logged forest, and plantations of rubber trees and oil palms in 2010.

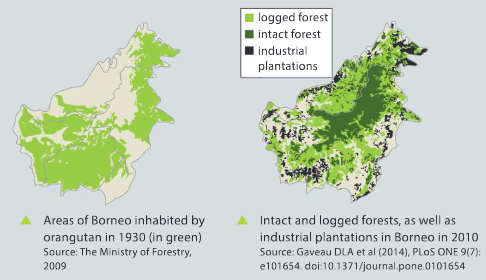
a) Analyse the information in the maps to assess whether or not:

i) orangutan originally inhabited all areas of forest on Borneo 

▶️Answer/Explanation

Ans: No, orangutan areas on 1930 map do not extend to all areas shown as forest on 2010 map.

ii) plantations of rubber or palm oil have been established in areas formerly inhabited by orangutan

▶️Answer/Explanation

Ans: Yes, as some of industrial plantations on 2010 map are shown as orangutan areas on 1930 map.

iii) areas of intact forest remain where orangutan were living in 1930.

▶️Answer/Explanation

Ans: Yes, as some areas of intact forest on 2010 map are shown with orangutans on 1930 map.

b) Discuss whether logging or clearance of forest for plantations has had more harmful effects on orangutan.

▶️Answer/Explanation

Ans: Both have affected large areas shown as orangutan habitat on 1930 map; but logged areas could regenerate as forest/ retain some trees so provide better orangutan habitat; so industrial plantations (probably) more harmful.


Measuring the energy content of vegetable oils

Question:

The table shows how much oil is produced per hectare (100 m × 100 m) when four different crops are grown and also the total global area of their production.

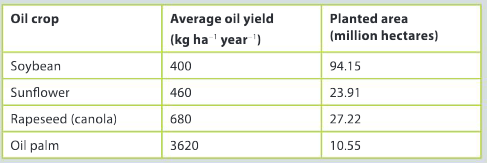
The yield of oil palm crops in kilograms per hectare is much higher than the other three crops, but to determine whether the energy yield per hectare is higher, the energy content of the different oils is needed.

a) Suggest a testable hypothesis for the relative amount of energy in palm oil and one other oil from the table.

▶️Answer/Explanation

Ans: Testable hypotheses: all vegetable oils have an energy content of about 40 MJ per kg (hypothesis based on energy values in databases)/yield of palm oil in kilograms per hectare is more than other oils so the energy content is lower (to give an equal energy yield per hectare)/alternative reasoned hypothesis.

b) Design an experiment to test your hypothesis by measuring the energy content of the two oils. This should include:

i) the types of oil that you will test 

▶️Answer/Explanation

Ans: Palm oil; another named oil (but if palm oil is unobtainable, two other oils could be used in the experiment).

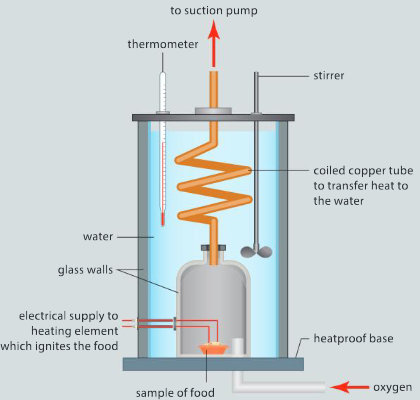
ii) how you will measure the energy content of the oil

▶️Answer/Explanation

Ans: Measure mass of a sample of oil; measure the volume of water that will be heated; ignite and burn the oil; use the flame from the burning oil to heat the water; measure the water temperature before and after burning the oil; 4.2 J of energy per cm3 of water and per degree Celsius of temperature rise (specific heat capacity of water).

iii) details of the variables you must keep constant in the experiment

▶️Answer/Explanation

Ans: Constant/known mass of oil; constant/known volume of water; constant size/surface area of tube to hold the water.

iv) risks and how you will minimize them.

▶️Answer/Explanation

Ans: Care needed to avoid burns from flame/hot tube; care to avoid spilling hot water and causing scalds; care with glassware to avoid breakages and cuts.

Analysis and evaluation

Question:

a) Present the results of your experiment to measure the energy content of oils in a clear and detailed results table. Remember to include row and column headings and SI units for quantitative variables. 

▶️Answer/Explanation

Ans: Columns with headings on table; rows with headings on table; table shows temperature before and after and preferably also temperature rise.

b) Display the results using a suitable type of graph or chart.

▶️Answer/Explanation

Ans: Bar chart; temperature rises shown with bars; y axis with temperature scale and appropriate legend.

c) Use calculations to evaluate the energy yields per hectare of palm oil and the other crop that you have investigated.

▶️Answer/Explanation

Ans: Energy yield per hectare = average yield (kg ha1 year1) × energy yield per kilogram (J kg1); correct calculations; palm oil yield per hectare is higher.

d) Suggest scientific reasons for the differences in energy yield between the crops.

▶️Answer/Explanation

Ans: More photosynthesis in palm oil crop; higher temperature so more photosynthesis; higher light intensity so more photosynthesis; higher proportion of energy from photosynthesis stored in oil by oil palms than by other crops

Sustainability of palm oil production

The article here was posted online in 2015 at http://theconversation.com/palm-oil-scourge-of-the-earth-or-wonder- crop-42165.
It was written by Denis J Murphy, who is Professor of Biotechnology at the University of South Wales, where he is an independent researcher and advisor to organizations that include the Food and Agriculture Organization of the United Nations and the Malaysian Palm Oil Board.
Read the passage and then answer the questions below.

Question:

List examples mentioned in the article of science helping to address problems caused by palm oil production.

▶️Answer/Explanation

Ans: Analysis of tropical peat soils; identification of peat soils on which palm oil can be grown without excessive CO2 emissions; identification of peat soils that should be conserved; life cycle assessment of oil crops; establishment of nature reserves in upland areas; establishment of wildlife corridors between reserves.

Question:

Denis Murphy gives a strong argument in support of palm oil production. Write a counter-argument based on the harm that palm oil production has caused to tropical ecosystems in South-East Asia. Apply scientific language effectively in your argument. 

▶️Answer/Explanation

Ans: Award marks in a range from 0 marks for invalid arguments not based on evidence to 5 marks for a convincing argument based on evidence.

Question:

There are links in the online version of this article to the sources of information used, which are scientific papers published in journals. Explain the importance of giving sources of information.

▶️Answer/Explanation

Ans: Shows that an article is based on evidence; gives academic credence; allows information/facts to be checked; allows data analysis/statistics to be checked; allows researchers to find other relevant sources.

Scroll to Top